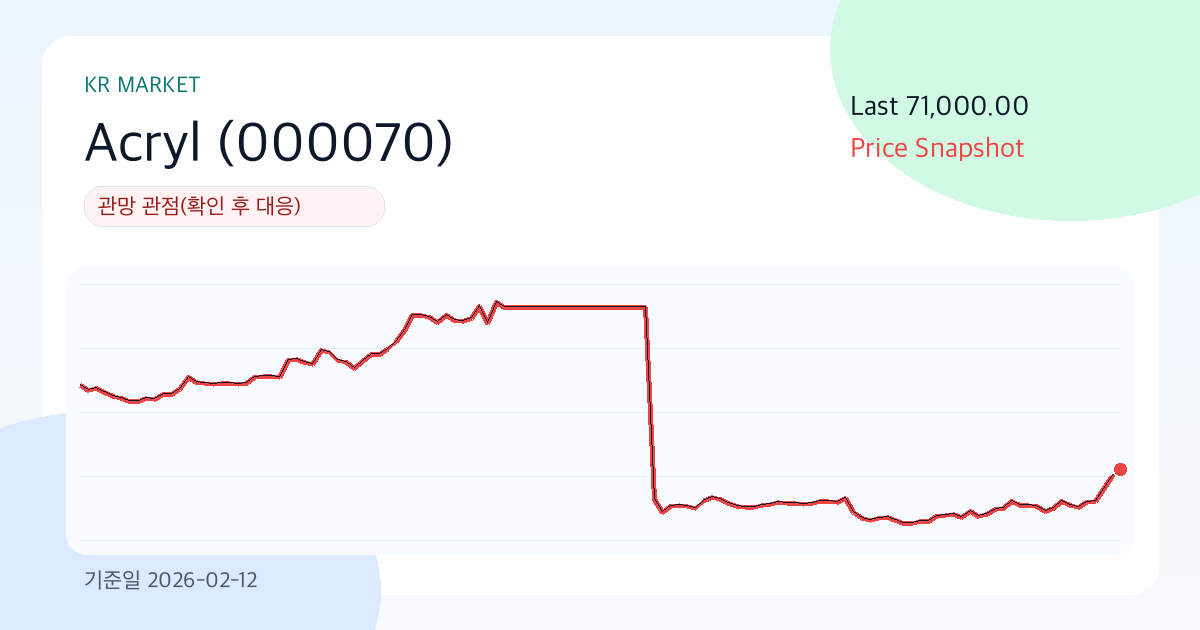
Acryl (000070) at 71000.00: a thin-ice zone where slower is smarter (As-of: 2026-02-12)
Summary
- View: Watch View (Wait for Confirmation)
- Conviction: Medium
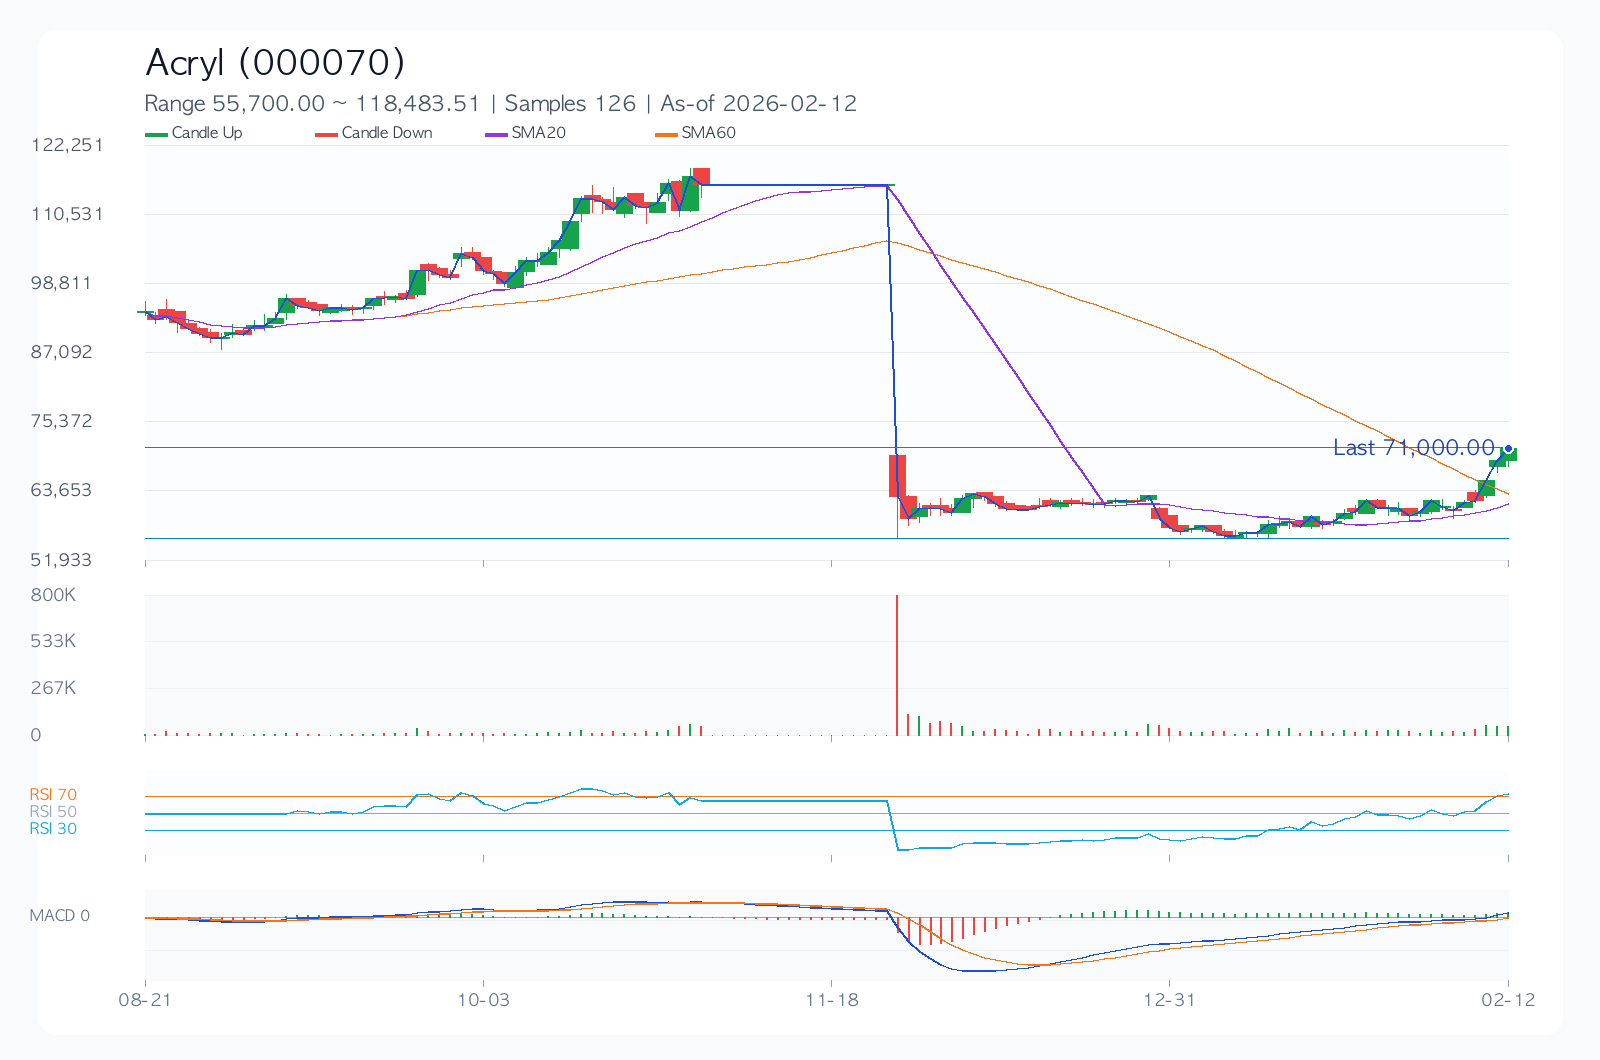
- Comment: Total score 53.9/100 (Value 48.4, Technical 42.6, Risk 86.0). Last 71000.00, support/resistance 56200.00/71000.00, 30D annualized volatility 31.8%.
When we open Acryl's chart today, rhythm matters more than noise. In this phase, headwinds are strong and waves are high, so it is better to define 'what invalidates the view' before making size decisions.
Value Logic
The value case is straightforward. If Acryl sustains earnings quality, and the market's pricing (P/E 18.0, P/B 2.0) does not compress too aggressively, the current valuation can remain explainable over time.
Editor's View
Personally, I would avoid aggressive bets in this zone; good business and good entry are not always the same. The mix of 3M return -38.6% and 30D annualized volatility 31.8% suggests both opportunity and loss-speed are elevated. If direction is right, momentum can accelerate fast; if wrong, recovery time can be longer than expected.
Technical Analysis
Technically, this is a optimism-heavy zone. That makes level management (support 56200.00 / resistance 71000.00) more important than emotional entries.
Desk Note
Chart temperature is elevated. Chasing can collect speeding tickets; pullback entries usually offer cleaner risk/reward.
Core Chart
Financial Metrics
| Metric | Value |
|---|---|
| Total Score | 53.9/100 |
| Value/Technical/Risk | 48.4 / 42.6 / 86.0 |
| Last Price | 71000.00 |
| 1M/3M/6M Return | 20.9% / -38.6% / -24.7% |
| 30D Annualized Volatility | 31.8% |
| Max Drawdown | -52.0% |
| 52W Range | 56200.00 ~ 117045.33 |
| SMA20/60/120 | 61615.00 / 63405.89 / 84218.46 |
| RSI(14) | 78.0 |
| Support/Resistance | 56200.00 / 71000.00 |
| Revenue Growth | 0.1% |
| Operating Margin | 5.2% |
| ROE | 3.1% |
| D/E | 0.49 |
| P/E / P/B | 18.0 / 2.0 |
| Dividend Yield | 4.9% |
Dividend (History & Sustainability)
Current sustainability assessment: Caution.
| Year | DPS | Payout Ratio |
|---|---|---|
| 2022 | 3872.01 | 95.9% |
| 2023 | 3872.01 | 95.9% |
| 2024 | 3872.01 | 95.9% |
| 2025 | 3500.00 | 95.9% |
| 2026 | 0.00 | 95.9% |
Investor-Style Simulation
| Style | Score(0-100) | Focus | Hypothetical Action |
|---|---|---|---|
| Warren Buffett Lens (Quality & Margin of Safety) | 24.6 | ROE 3.1%, operating margin 5.2%, D/E 0.49, P/E 18.0 | Quality may be acceptable, but valuation cushion looks insufficient now. |
| Peter Lynch Lens (Growth vs Price) | 0.0 | Revenue growth 0.1%, PEG-like 18.00, 6M return -24.7% | Narrative exists, but price-vs-growth attractiveness is still weak. |
| George Soros Lens (Trend & Reflexivity) | 38.9 | 1M/3M return 20.9%/-38.6%, volatility 31.8%, RSI 78.0 | Trend reliability is low; wait for clearer reversal evidence. |
Recent News (Sources)
- Acryl 최신 공시/뉴스 허브 확인 포인트 1 (Yahoo Finance, 2026-02-12)
- Acryl 최신 공시/뉴스 허브 확인 포인트 2 (Yahoo Finance, 2026-02-12)
- Acryl 최신 공시/뉴스 허브 확인 포인트 3 (Yahoo Finance, 2026-02-12)
Key Risks
Risk management matters more than perfect forecasting. For Acryl, this section is less a warning and more a protection framework for position discipline around leverage (D/E 0.49), valuation sensitivity (P/E 18.0), and volatility (31.8%).
- Lower operating margin can weaken earnings defense under input-cost pressure or pricing competition.
- Historical max drawdown (-52.0%) indicates downside can extend quickly in renewed selloffs.
- Consensus revision direction and management guidance tone can dominate short-term price direction.
- Regulatory, legal, or policy shifts can rapidly reframe valuation assumptions.
Counter-Arguments & Invalidation
- If price remains below support 56200.00 for ~2 weeks, current trend thesis weakens.
- If next-quarter revenue growth slows materially below current run-rate, downgrade the base thesis.
- If consensus EPS revisions stay negative for multiple weeks post-earnings, reset scenario weights.
Checklist
Before next event
- Check direction of EPS revisions across the next two quarters (up/down).
- Confirm leverage and cash-flow resilience under slower growth.
- Re-check entry asymmetry around support/resistance and stop distance.
Portfolio memo
Volatility is not extreme, but event windows can still move the tape sharply. Near overbought conditions, pullback confirmation tends to offer better asymmetry than chasing.
Pre-trade checks
- [ ] Have I defined an explicit invalidation price/condition?
- [ ] Is my position size consistent with recent volatility?
- [ ] Do I have a post-earnings scenario update plan?
- [ ] Is downside risk acceptable under the bear case?
Conclusion (Bull / Base / Bear)
| Scenario | Thesis | Trigger | Target Price | Expected Return |
|---|---|---|---|---|
| Bull | Earnings surprise and valuation resilience occur together | Faster revenue growth with upward guidance revisions | 76020.72 | 7.1% |
| Base | Results land near consensus while valuation stays neutral | Margin defense with neutral positioning/flow | 67875.65 | -4.4% |
| Bear | Growth decelerates and valuation compresses simultaneously | Guidance cuts with higher risk-premium pressure | 55658.03 | -21.6% |
The base-path target is 67875.65. However, the spread between bull (7.1%) and bear (-21.6%) outcomes is wide, so conditional response matters more than static conviction.
Related Reports
Recent notes from the same market to compare assumptions.
- Naver (035420) KRW 254,500 | 3-Month +2.2% | Volatility 43.9% | Entry Timing Check Zone (As of: 2026-02-20) (As-of 2026-02-20)
- Grand Korea Leisure (114090) 13350.00 | 3M -6.1% | Vol 26.7% | Entry Timing Check Zone (As of: 2026-02-20) (As-of 2026-02-20)
- SK Hynix (000660) 949000.00 | 3M +66.5% | Vol 61.5% | Momentum Check Phase (As of: 2026-02-20) (As-of 2026-02-20)
- [The Market's Bare Face] Kakao Bank: Walking the Tightrope Between a Blocked Ceiling and a Solid Floor (As-of: 2026-02-19) (As-of 2026-02-19)