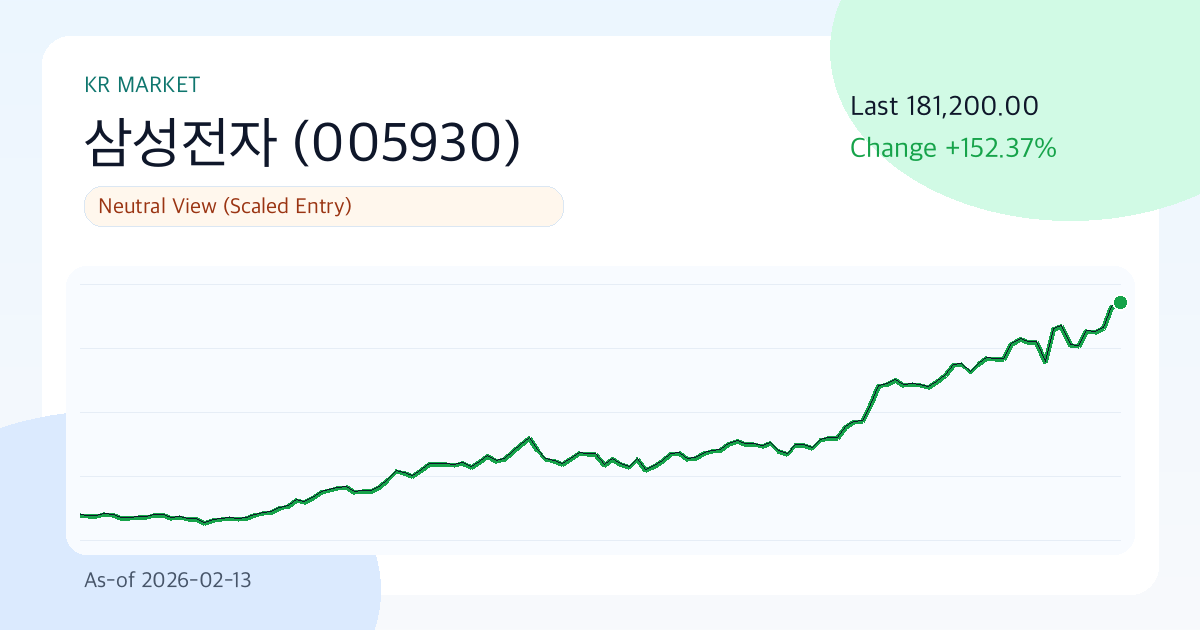
Samsung Electronics (005930) ₩181,200 | 3-Month +86.4% | Annualized Volatility 55.1% | Entry Timing Check Zone (As of: 2026-02-13)
Summary
- One-Line Judgment: Neutral Outlook (Phased Approach)
- Confidence Level: Moderate
- Comment: Samsung Electronics is currently trading at ₩181,200. While it has achieved a 3-month return of 86.4%, it is experiencing volatility of 55.1%. This is a time that requires a cautious, phased approach, closely monitoring macroeconomic changes and the semiconductor industry's outlook.
Key Points (3 Lines)
- The key for this period is whether the price remains above the 20-day moving average (₩160,415). If it does, short-term supply and demand are likely to be positive.
- An operating profit margin of 21.3% and ROE of 10.8% signal solid core business strength, but the debt-to-equity ratio of 5.79 necessitates consideration of interest rate sensitivity.
- Based on a dividend yield of 1.2% and an average dividend payout ratio of 30.3%, the sustainability of dividends is at a 'cautionary' level.
Samsung Electronics' current chart requires reading the rhythm before the numbers. The current phase calls for caution, awaiting data updates rather than conviction. It is wise to pre-determine 'when to change your judgment.'
Investment Thesis (Value)
The key is whether growth and profitability are aligned. If Samsung Electronics' profit-generating ability is maintained and the market's valuation (PER 8.6, PBR 2.0) does not fluctuate significantly, the current stock price will gain justification over time.
The core question is whether the combination of financial strength (operating profit margin 21.3%, ROE 10.8%) and recent stock momentum (3-month +86.4%) can drive further valuation increases in the next 1-2 quarters.
- Growth: A revenue growth rate of 23.8% indicates top-line expansion.
- Profitability: An operating profit margin of 21.3% and ROE of 10.8% can be interpreted as being at the lower end of the normal range.
- Valuation: PER 8.6 and PBR 2.0 are classified as neutral or reasonable ranges.
- Capital Return: The combination of an average dividend payout ratio of 30.3% and a dividend yield of 1.2% suggests limited shareholder return attractiveness.
Unique Argument of This Report (Basis)
- The primary basis for the current judgment is the supply and demand directionality created by the recent 3-month return of 86.4% and the price's position relative to the 20-day moving average (₩160,415).
- Financial soundness is assessed by the operating profit margin of 21.3% and ROE of 10.8%; if both indicators decline simultaneously, the investment thesis weakens.
- Valuation metrics (PER 8.6, PBR 2.0) are assessed against the growth rate of 23.8% to determine if they are excessive, serving as the core basis for this report's judgment.
Technical Analysis
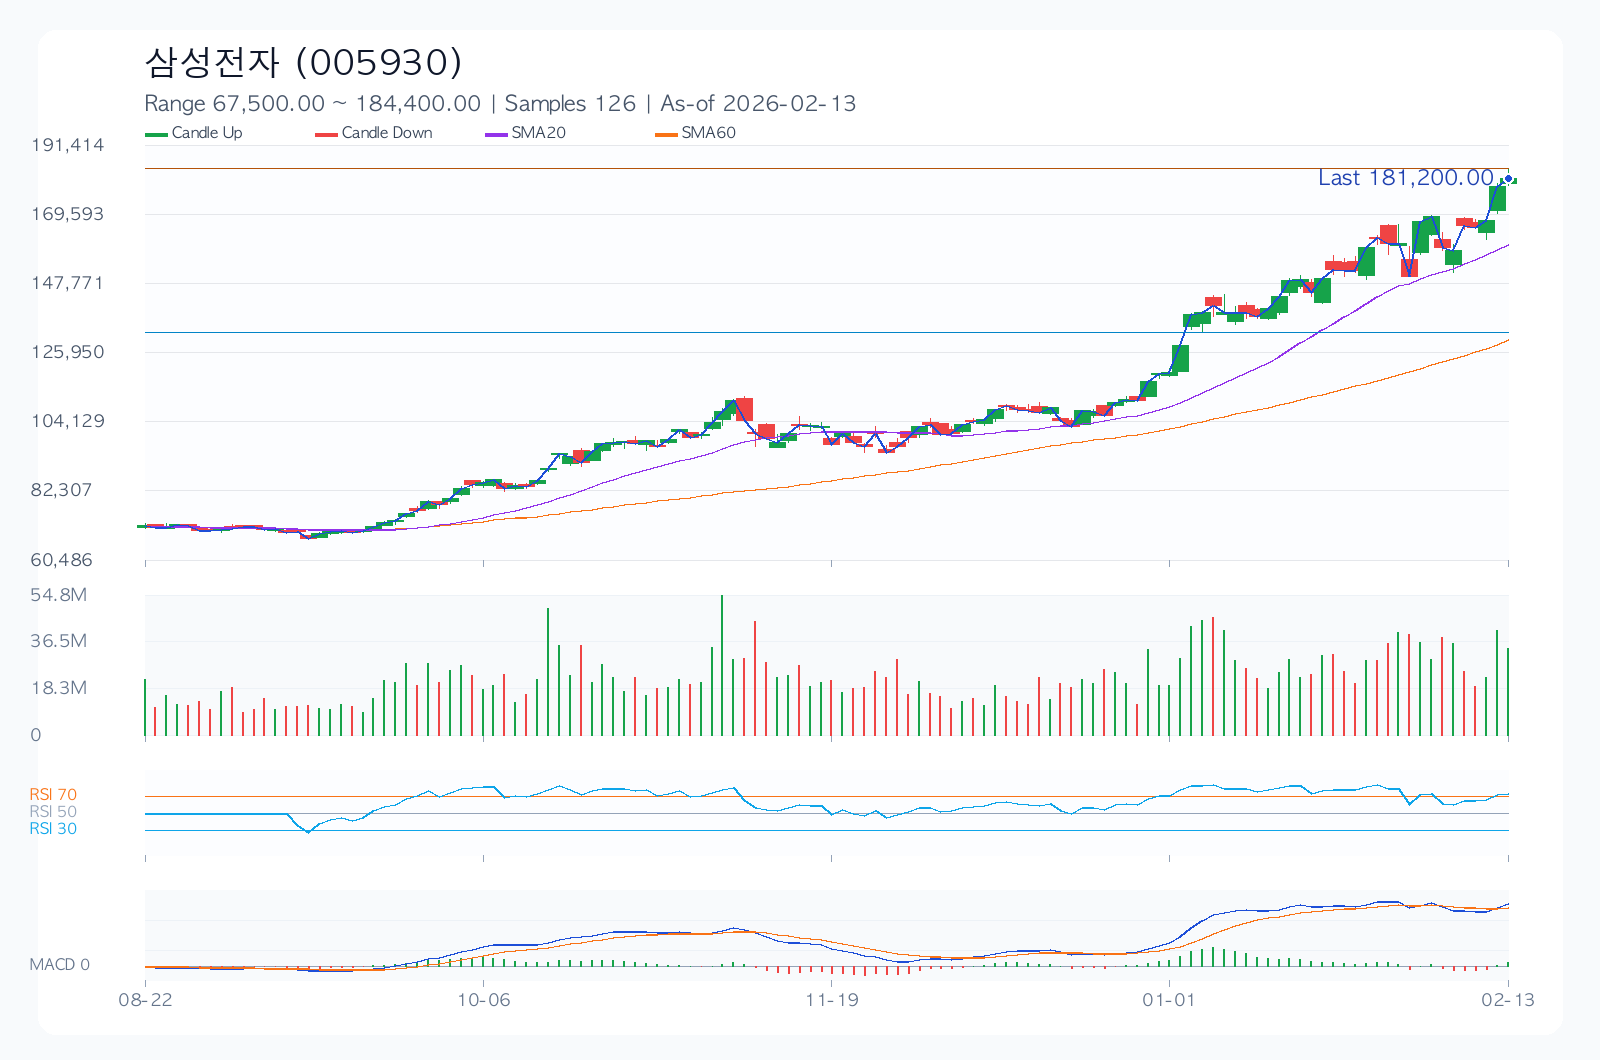
Technically, this is a point where conviction and doubt intersect. Therefore, focusing on level management (support ₩137,600 / resistance ₩181,200) rather than chasing the rally is likely to determine performance.
- Trend: The 20-day (₩160,415), 60-day (₩130,333.33), and 120-day (₩108,640.42) moving averages are in a positive alignment.
- Momentum: With 1-month returns of 21.7%, 3-month returns of 86.4%, and 6-month returns of 152.4%, mid-term momentum is dominant.
- Overbought/Oversold: The RSI(14) index is at 69.3, positioned in the neutral zone.
- Volatility/Drawdown: 30-day annualized volatility of 55.1% and a maximum drawdown of -43.2% are important benchmarks for position sizing.
- Price Levels: A breakthrough or breakdown of the short-term support at ₩137,600 and resistance at ₩181,200 is likely to signal a trend reversal.
Desk Memo (Brief Comment)
Today's market calls for establishing stop-loss rules first. Given the high volatility, simply reducing position size can prevent drastic fluctuations in returns.
Key Chart
Financial Statements & Indicators
| Category | Value |
|---|---|
| Overall Score | 64.6/100 |
| Value/Technical/Risk | 51.2 / 78.2 / 71.0 |
| Current Price | 181200.00 |
| 1M/3M/6M Return | 21.7% / 86.4% / 152.4% |
| 30-Day Annualized Volatility | 55.1% |
| Max Drawdown (MDD) | -43.2% |
| 52-Week Range | 52900.00 ~ 181200.00 |
| 20/60/120-Day MA | 160415.00 / 130333.33 / 108640.42 |
| RSI(14) | 69.3 |
| Short-Term Support/Resistance | 137600.00 / 181200.00 |
| Revenue Growth Rate | 23.8% |
| Operating Profit Margin | 21.3% |
| ROE | 10.8% |
| D/E | 5.79 |
| PER / PBR | 8.6 / 2.0 |
| Dividend Yield | 1.2% |
Dividends (History & Sustainability)
The key to dividends is not just the yield itself, but whether the policy is maintained even amidst an economic downturn. The current sustainability of dividends is assessed at a 'cautionary' level.
| Year | DPS | Payout Ratio |
|---|---|---|
| 2022 | 1444.00 | 30.3% |
| 2023 | 1444.00 | 30.3% |
| 2024 | 1446.00 | 30.3% |
| 2025 | 1668.00 | 30.3% |
Investment Guru Perspective Simulation
The following content is not a replication of actual trades by investment gurus, but a simulation applying the core questions of each investment philosophy to the current data.
| Perspective | Style Score (0-100) | Current Focus | Hypothetical Action Scenario |
|---|---|---|---|
| Warren Buffett (Quality & Margin of Safety) | 0.0 | ROE 10.8%, Operating Profit Margin 21.3%, D/E 5.79, PER 8.6 | Quality is confirmed, but insufficient price margin of safety; holding off. |
| Peter Lynch (Growth & Price Balance) | 89.2 | Revenue Growth Rate 23.8%, PEG Ratio ~0.36, 6-Month Return 152.4% | Monitoring if the growth story translates into quarterly earnings; considering increasing position. |
| George Soros (Trend & Speed of Reaction) | 100.0 | 1M/3M Returns 21.7%/86.4%, Volatility 55.1%, RSI 69.3 | In a fast-reacting price zone; strengthening short-term trading perspective upon catalyst occurrence. |
Key Risks
Preparation for worst-case scenarios is more critical. For Samsung Electronics, risk management serves as a safety net for maintaining positions. In the current phase, changes in valuation (PER 8.6, PBR 2.0) and 30-day annualized volatility (55.1%) can determine the speed of downside risk.
- Due to a debt-to-equity ratio of 5.79, financial vulnerability may be exposed with rising interest rates or increased borrowing costs.
- Annualized volatility of 55.1% suggests the possibility of sharp price movements during events, making adherence to stop-loss rules essential.
- The recent maximum drawdown of -43.2% implies a risk of breaking psychological support levels if a downtrend resumes.
- Changes in consensus estimates and guidance comments before and after earnings announcements can significantly impact short-term stock direction.
- Regulations, lawsuits, and policy changes (trade, antitrust, financial regulations, etc.) can drastically alter the valuation framework.
Counterarguments and Invalidation Conditions
The counterargument is that 'valuation burden (PER 8.6, PBR 2.0) or a slowdown in demand, if confirmed, could lead to a faster multiple contraction than earnings improvement.'
- If the price remains below the short-term support level of ₩137,600 for more than two weeks, the current trend assumption will be considered invalid.
- If the next quarter's revenue growth rate slows to below 20.8%, the growth thesis requires re-evaluation.
- If the consensus EPS is revised downwards for four consecutive weeks after the earnings announcement, the base scenario will be lowered.
Checklist
Must-See Before Next Disclosure/Earnings
- Confirm if the revenue growth rate remains above 21.8% in the next quarterly earnings announcement.
- Monitor whether the stock price successfully defends the short-term support level of ₩137,600.
- Check if the trend of consensus EPS estimates being revised upwards for four consecutive weeks is observed.
Portfolio Management Notes
As this is a period of high volatility, concentrated investments in specific stocks are not recommended. A neutral investment stance, prioritizing the establishment of conditional entry criteria over directional bets, is a rational approach.
Pre-Decision Check
- Have the direction of consensus EPS for the next two quarters (upward/downward) been clearly identified?
- Can the financial structure (D/E, interest coverage ratio, cash flow) withstand an economic slowdown?
- Does the entry price offer a risk-reward ratio of at least 1:2 compared to support/resistance levels?
- Are dividend policies (increase/maintain/decrease) and share buyback/retirement policies being consistently pursued?
- Has the maximum acceptable loss in the event of a pessimistic scenario been pre-determined?
Conclusion (Optimistic, Base, Pessimistic 3 Scenarios)
| Scenario | Assumption | Key Trigger | Target Price (Model) | Expected Return |
|---|---|---|---|---|
| Optimistic | Earnings surprise coupled with multiple expansion occurs | Accelerating revenue growth + upward guidance revision | 200476.20 | 10.6% |
| Base | Earnings meet consensus expectations, and multiples remain at current levels | Margin defense + neutral supply/demand | 178996.61 | -1.2% |
| Pessimistic | Earnings slowdown coupled with multiple contraction occurs | Downward guidance revision + risk premium expansion | 146777.22 | -19.0% |
The base scenario target price is ₩178,996.61. However, given the wide gap between the optimistic (10.6%) and pessimistic (-19.0%) scenarios, focusing on 'conditional response' rather than finding the 'correct answer' is a more appropriate approach.
Data Sources
- Data As Of:
2026-02-13 - Report Generated On:
2026-02-18 - Original Stock Link: https://finance.yahoo.com/quote/005930.KS
- Source Data: Yahoo Finance Price/Quote
Related Reports
Recent notes from the same market to compare assumptions.
- Naver (035420) KRW 254,500 | 3-Month +2.2% | Volatility 43.9% | Entry Timing Check Zone (As of: 2026-02-20) (As-of 2026-02-20)
- Grand Korea Leisure (114090) 13350.00 | 3M -6.1% | Vol 26.7% | Entry Timing Check Zone (As of: 2026-02-20) (As-of 2026-02-20)
- SK Hynix (000660) 949000.00 | 3M +66.5% | Vol 61.5% | Momentum Check Phase (As of: 2026-02-20) (As-of 2026-02-20)
- [The Market's Bare Face] Kakao Bank: Walking the Tightrope Between a Blocked Ceiling and a Solid Floor (As-of: 2026-02-19) (As-of 2026-02-19)