Ambev S.A. (ABEV) at 3.11: a zone where the compass matters more than speed (As-of: 2026-02-13)
Summary
- View: Neutral View (Scaled Entry)
- Conviction: High
- Comment: Total score 71.0/100 (Value 60.7, Technical 67.7, Risk 100.0). Last 3.11, support/resistance 2.47/3.20, 30D annualized volatility 23.1%.
When we open Ambev S.A.'s chart today, rhythm matters more than noise. In this phase, tailwinds are visible while volatility is still manageable, so it is better to define 'what invalidates the view' before making size decisions.
Value Logic
The value case is straightforward. If Ambev S.A. sustains earnings quality, and the market's pricing (P/E 17.3, P/B 2.9) does not compress too aggressively, the current valuation can remain explainable over time.
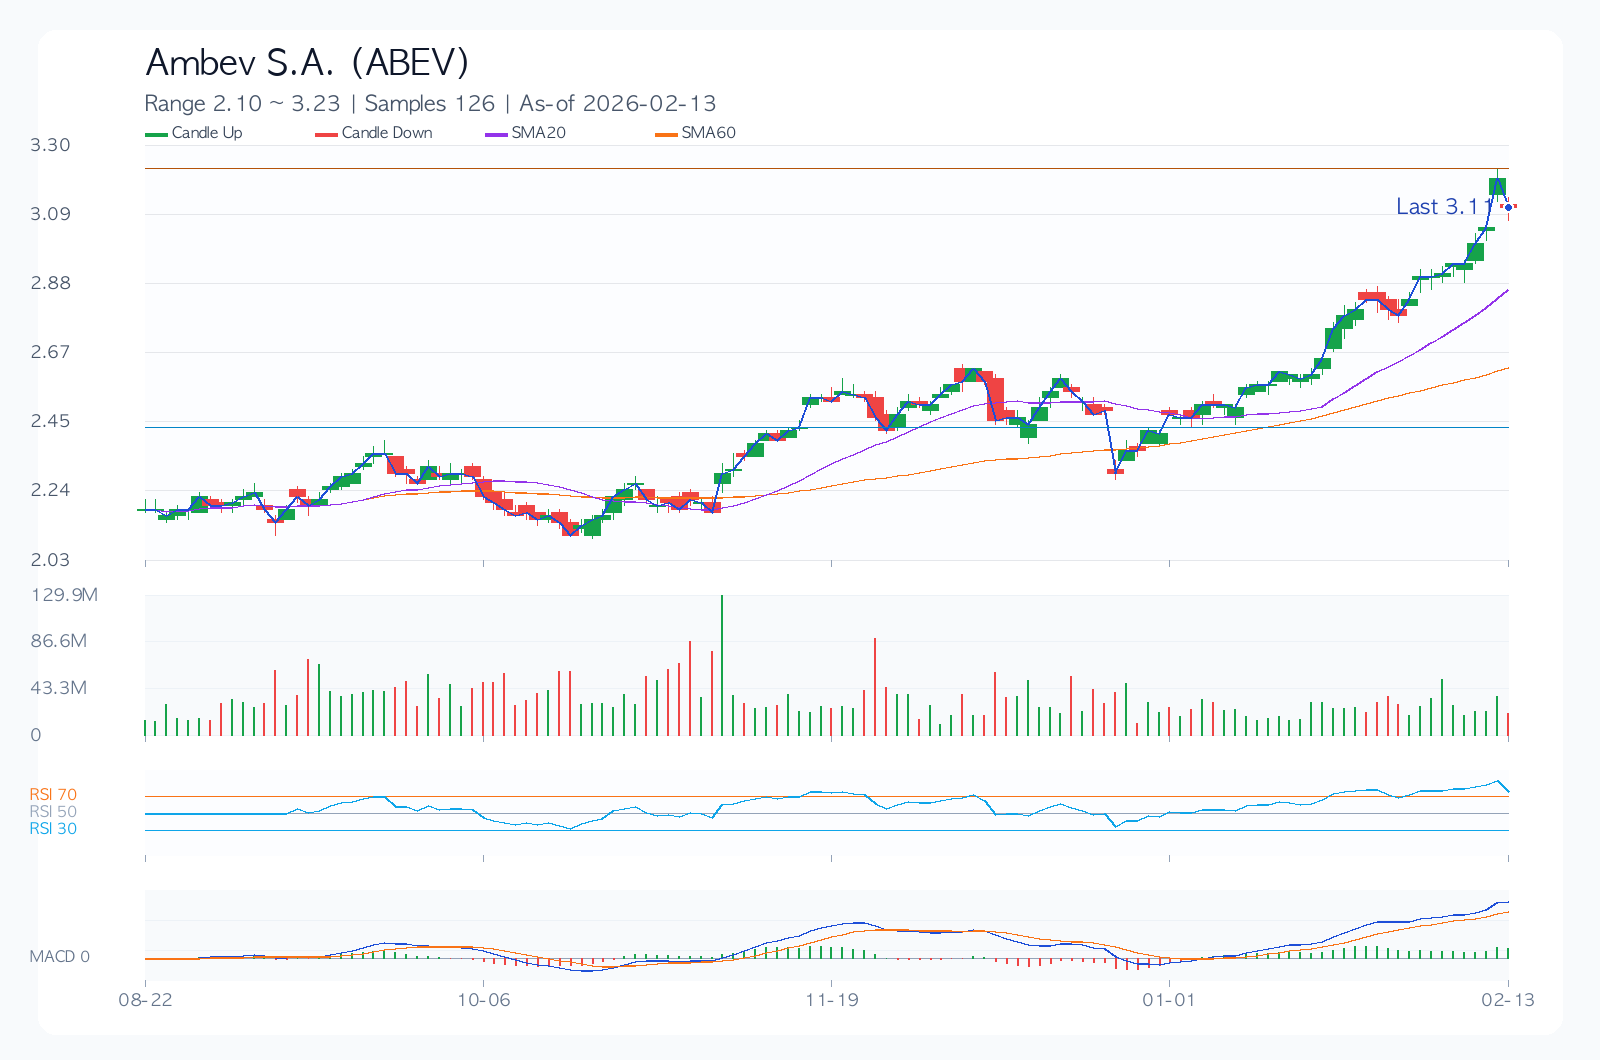
Technical Analysis
Technically, this is a optimism-heavy zone. That makes level management (support 2.47 / resistance 3.20) more important than emotional entries.
Core Chart
Financial Metrics
| Metric | Value |
|---|---|
| Total Score | 71.0/100 |
| Value/Technical/Risk | 60.7 / 67.7 / 100.0 |
| Last Price | 3.11 |
| 1M/3M/6M Return | 19.6% / 23.4% / 42.0% |
| 30D Annualized Volatility | 23.1% |
| Max Drawdown | -34.2% |
| 52W Range | 1.87 ~ 3.20 |
| SMA20/60/120 | 2.86 / 2.62 / 2.45 |
| RSI(14) | 76.3 |
| Support/Resistance | 2.47 / 3.20 |
| Revenue Growth | -8.2% |
| Operating Margin | 28.3% |
| ROE | 17.0% |
| D/E | 0.20 |
| P/E / P/B | 17.3 / 2.9 |
| Dividend Yield | 10.0% |
Key Risks
Risk management matters more than perfect forecasting. For Ambev S.A., this section is less a warning and more a protection framework for position discipline around leverage (D/E 0.20), valuation sensitivity (P/E 17.3), and volatility (23.1%).
- Historical max drawdown (-34.2%) indicates downside can extend quickly in renewed selloffs.
- Consensus revision direction and management guidance tone can dominate short-term price direction.
- Regulatory, legal, or policy shifts can rapidly reframe valuation assumptions.
- Competitive pressure in core segments may erode share or margin resilience.
Related Reports
Recent notes from the same market to compare assumptions.
- JPMorgan Chase(JPM) 289.48 | 3M -8.4% | Vol 26.8% | Risk Management Priority Zone (As of: 2026-03-06) (As-of 2026-03-06)
- Broadcom(AVGO) 330.48 | 3M -13.3% | Vol 37.5% | Entry Timing Check Zone (As of: 2026-03-06) (As-of 2026-03-06)
- Meta Platforms(META) 644.86 | 3M -2.5% | Vol 40.0% | Entry Timing Check Zone (As of: 2026-03-06) (As-of 2026-03-06)
- Exxon Mobil(XOM) 151.21 | 3M +29.1% | Vol 28.3% | Entry Timing Check Zone (As of: 2026-03-06) (As-of 2026-03-06)