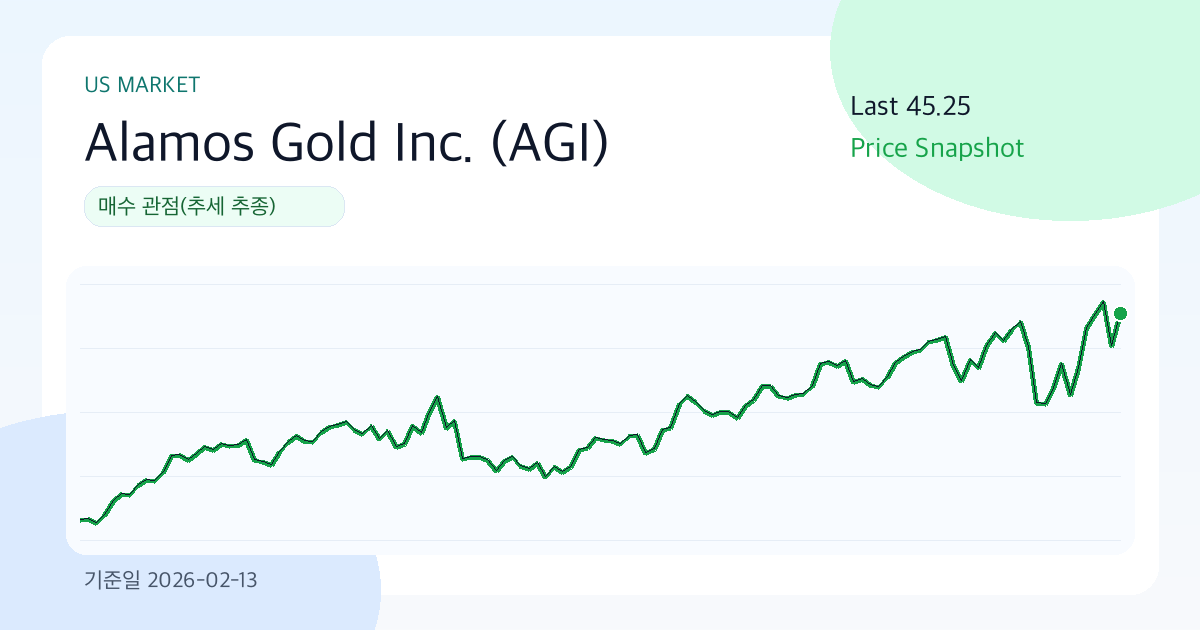
Alamos Gold Inc. (AGI) at 45.25: wind filling the sails again (As-of: 2026-02-13)
Summary
- View: Buy View (Trend Following)
- Conviction: Medium
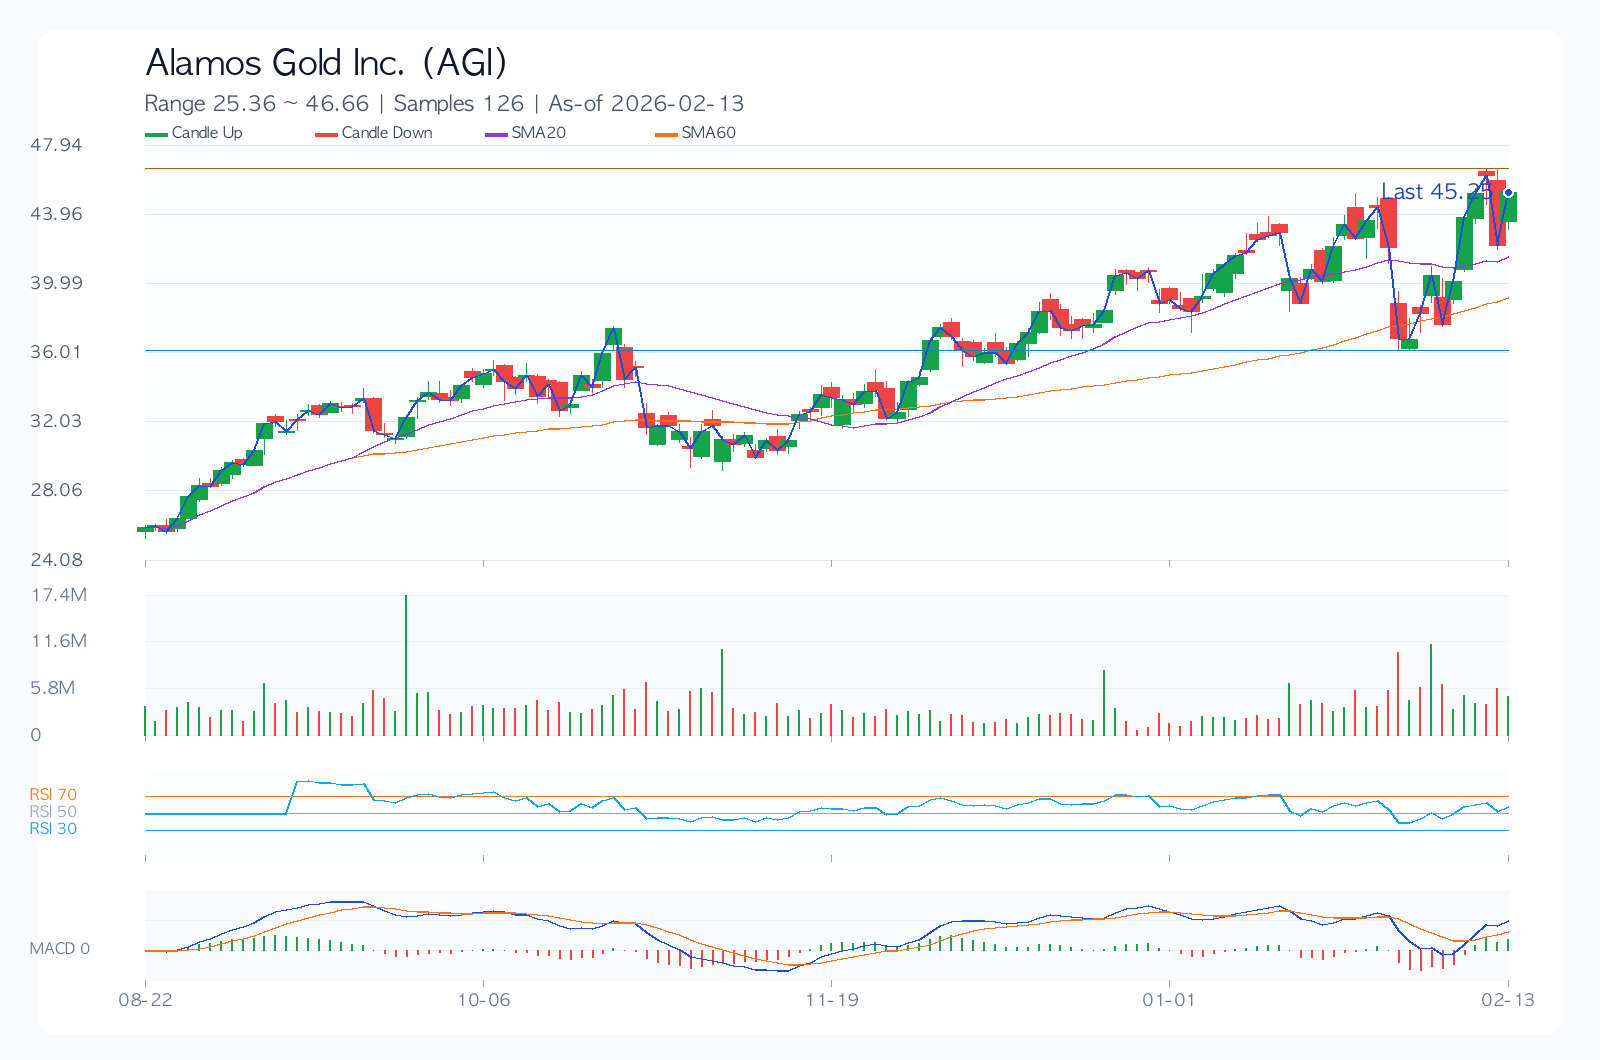
- Comment: Total score 73.9/100 (Value 70.0, Technical 74.4, Risk 82.0). Last 45.25, support/resistance 36.83/46.25, 30D annualized volatility 75.9%.
When we open Alamos Gold Inc.'s chart today, rhythm matters more than noise. In this phase, direction is mixed and conviction depends on incoming data, so it is better to define 'what invalidates the view' before making size decisions.
Value Logic
The value case is straightforward. If Alamos Gold Inc. sustains earnings quality, and the market's pricing (P/E 35.4, P/B 4.7) does not compress too aggressively, the current valuation can remain explainable over time.
Editor's View
I would avoid oversized first entries and add on confirmation while trend structure holds. The mix of 3M return 35.2% and 30D annualized volatility 75.9% suggests both opportunity and loss-speed are elevated. If direction is right, momentum can accelerate fast; if wrong, recovery time can be longer than expected.
Technical Analysis
Technically, this is a balanced between conviction and doubt zone. That makes level management (support 36.83 / resistance 46.25) more important than emotional entries.
Desk Note
Today is one of those sessions where stop rules matter more than coffee. Volatility is high, so position sizing does most of the risk work.
Core Chart
Financial Metrics
| Metric | Value |
|---|---|
| Total Score | 73.9/100 |
| Value/Technical/Risk | 70.0 / 74.4 / 82.0 |
| Last Price | 45.25 |
| 1M/3M/6M Return | 12.3% / 35.2% / 74.1% |
| 30D Annualized Volatility | 75.9% |
| Max Drawdown | -21.5% |
| 52W Range | 22.30 ~ 46.25 |
| SMA20/60/120 | 41.57 / 39.23 / 35.91 |
| RSI(14) | 54.1 |
| Support/Resistance | 36.83 / 46.25 |
| Revenue Growth | 28.1% |
| Operating Margin | 80.7% |
| ROE | 14.3% |
| D/E | 0.07 |
| P/E / P/B | 35.4 / 4.7 |
| Dividend Yield | 22.0% |
Dividend (History & Sustainability)
Current sustainability assessment: Healthy.
| Year | DPS | Payout Ratio |
|---|---|---|
| 2022 | 0.10 | 7.8% |
| 2023 | 0.10 | 7.8% |
| 2024 | 0.10 | 7.8% |
| 2025 | 0.05 | 7.8% |
| 2026 | 0.00 | 7.8% |
Investor-Style Simulation
| Style | Score(0-100) | Focus | Hypothetical Action |
|---|---|---|---|
| Warren Buffett Lens (Quality & Margin of Safety) | 90.1 | ROE 14.3%, operating margin 80.7%, D/E 0.07, P/E 35.4 | Consider scaled accumulation and long hold if business quality remains intact. |
| Peter Lynch Lens (Growth vs Price) | 93.9 | Revenue growth 28.1%, PEG-like 1.26, 6M return 74.1% | Track whether growth narrative keeps converting into quarterly numbers. |
| George Soros Lens (Trend & Reflexivity) | 68.1 | 1M/3M return 12.3%/35.2%, volatility 75.9%, RSI 54.1 | Treat as a fast-reaction zone; lean tactical when catalysts hit. |
Recent News (Sources)
- Does Alamos Gold's (TSX:AGI) Multi‑Year Output Plan Redefine Its Long‑Term Value‑Creation Playbook? (Simply Wall St., 2026-02-11)
- Analysts Respond Positively To Alamos Gold’s (AGI) Island Gold District Expansion Study (Insider Monkey, 2026-02-13)
- Bank of America Raises its Price Target on Alamos Gold Inc. (AGI) to $48 and Maintains a Buy Rating (Insider Monkey, 2026-02-11)
Key Risks
Risk management matters more than perfect forecasting. For Alamos Gold Inc., this section is less a warning and more a protection framework for position discipline around leverage (D/E 0.07), valuation sensitivity (P/E 35.4), and volatility (75.9%).
- At P/E 35.4, valuation is vulnerable to multiple compression if earnings disappoint.
- 30D annualized volatility at 75.9% implies larger event-driven swings; stop discipline is required.
- Consensus revision direction and management guidance tone can dominate short-term price direction.
- Regulatory, legal, or policy shifts can rapidly reframe valuation assumptions.
Counter-Arguments & Invalidation
- If price remains below support 36.83 for ~2 weeks, current trend thesis weakens.
- If next-quarter revenue growth slows materially below current run-rate, downgrade the base thesis.
- If consensus EPS revisions stay negative for multiple weeks post-earnings, reset scenario weights.
Checklist
Before next event
- Check direction of EPS revisions across the next two quarters (up/down).
- Confirm leverage and cash-flow resilience under slower growth.
- Re-check entry asymmetry around support/resistance and stop distance.
Portfolio memo
Volatility is high; concentrated single-name exposure is not preferred. In a neutral oscillator zone, conditional entries are more rational than directional impulse bets.
Pre-trade checks
- [ ] Have I defined an explicit invalidation price/condition?
- [ ] Is my position size consistent with recent volatility?
- [ ] Do I have a post-earnings scenario update plan?
- [ ] Is downside risk acceptable under the bear case?
Conclusion (Bull / Base / Bear)
| Scenario | Thesis | Trigger | Target Price | Expected Return |
|---|---|---|---|---|
| Bull | Earnings surprise and valuation resilience occur together | Faster revenue growth with upward guidance revisions | 53.74 | 18.8% |
| Base | Results land near consensus while valuation stays neutral | Margin defense with neutral positioning/flow | 47.99 | 6.0% |
| Bear | Growth decelerates and valuation compresses simultaneously | Guidance cuts with higher risk-premium pressure | 39.35 | -13.0% |
The base-path target is 47.99. However, the spread between bull (18.8%) and bear (-13.0%) outcomes is wide, so conditional response matters more than static conviction.
Related Reports
Recent notes from the same market to compare assumptions.
- JPMorgan Chase(JPM) 289.48 | 3M -8.4% | Vol 26.8% | Risk Management Priority Zone (As of: 2026-03-06) (As-of 2026-03-06)
- Broadcom(AVGO) 330.48 | 3M -13.3% | Vol 37.5% | Entry Timing Check Zone (As of: 2026-03-06) (As-of 2026-03-06)
- Meta Platforms(META) 644.86 | 3M -2.5% | Vol 40.0% | Entry Timing Check Zone (As of: 2026-03-06) (As-of 2026-03-06)
- Exxon Mobil(XOM) 151.21 | 3M +29.1% | Vol 28.3% | Entry Timing Check Zone (As of: 2026-03-06) (As-of 2026-03-06)