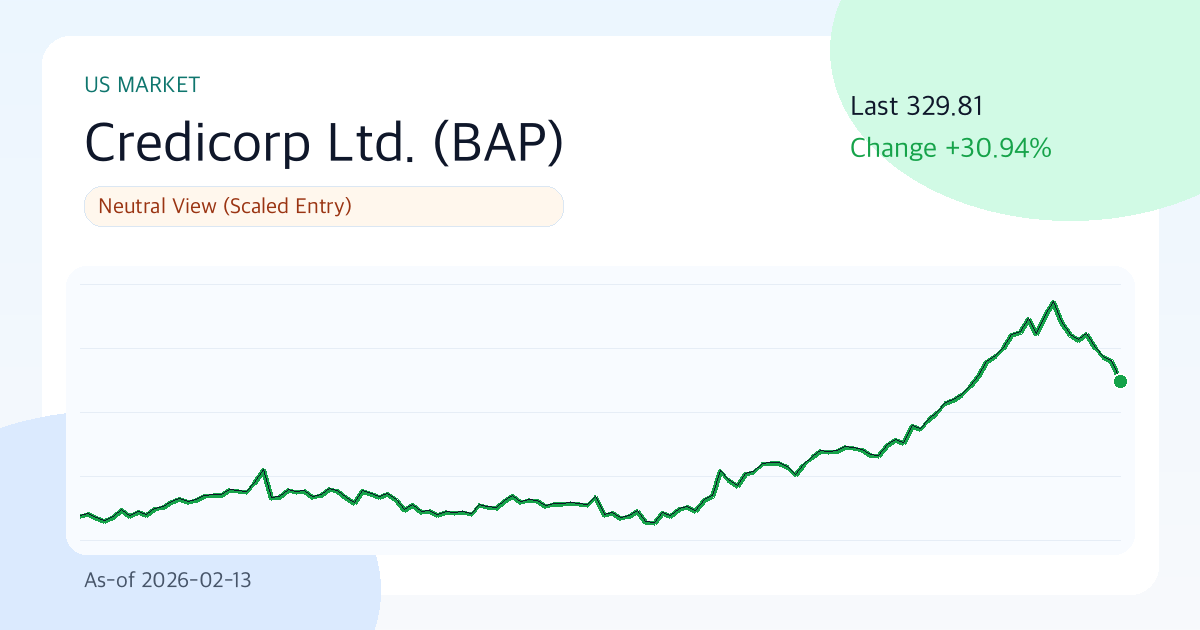
Credicorp Ltd. (BAP) at 329.81: a zone where the compass matters more than speed (As-of: 2026-02-13)
Summary
- View: Neutral View (Scaled Entry)
- Conviction: High
- Comment: Total score 63.0/100 (Value 58.5, Technical 55.1, Risk 87.0). Last 329.81, support/resistance 286.41/375.25, 30D annualized volatility 28.5%.
When we open Credicorp Ltd.'s chart today, rhythm matters more than noise. In this phase, direction is mixed and conviction depends on incoming data, so it is better to define 'what invalidates the view' before making size decisions.
Value Logic
The value case is straightforward. If Credicorp Ltd. sustains earnings quality, and the market's pricing (P/E 13.9, P/B 2.3) does not compress too aggressively, the current valuation can remain explainable over time.
Editor's View
My bias here is patience: keep it on watch and wait for one more data confirmation. The mix of 3M return 30.8% and 30D annualized volatility 28.5% suggests both opportunity and loss-speed are elevated. If direction is right, momentum can accelerate fast; if wrong, recovery time can be longer than expected.
Technical Analysis
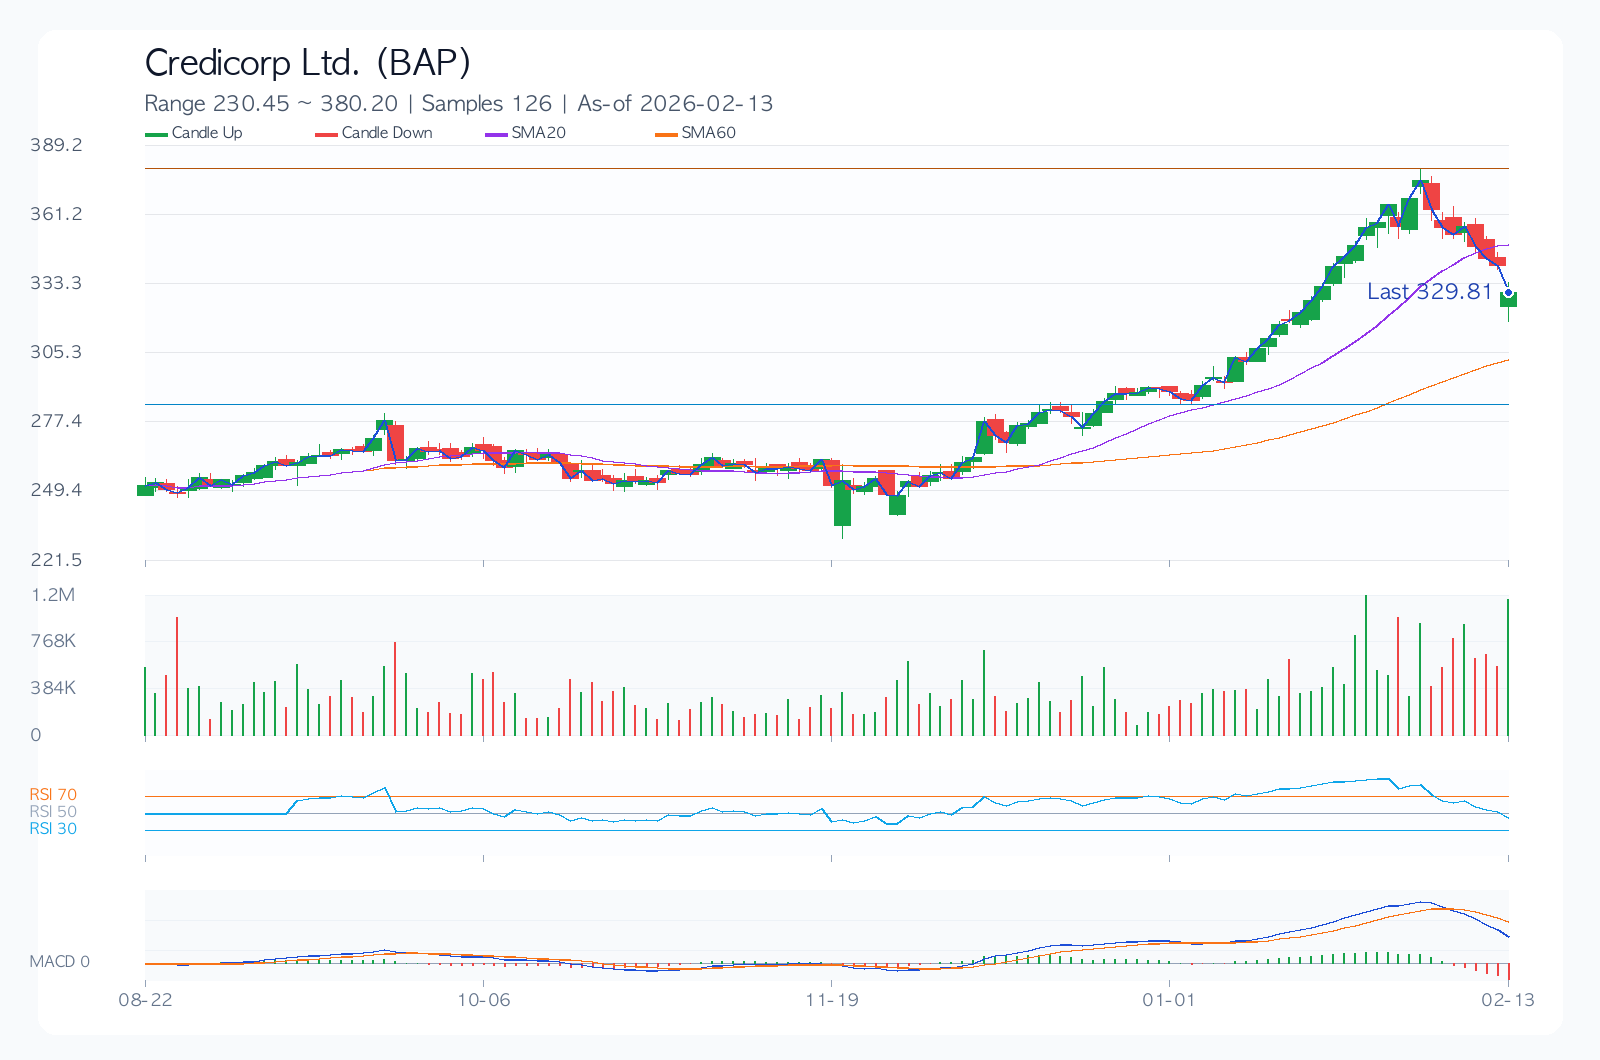
Technically, this is a balanced between conviction and doubt zone. That makes level management (support 286.41 / resistance 375.25) more important than emotional entries.
Desk Note
Not a dramatic tape, but these ordinary sessions are where disciplined process compounds.
Core Chart
Financial Metrics
| Metric | Value |
|---|---|
| Total Score | 63.0/100 |
| Value/Technical/Risk | 58.5 / 55.1 / 87.0 |
| Last Price | 329.81 |
| 1M/3M/6M Return | 3.5% / 30.8% / 30.9% |
| 30D Annualized Volatility | 28.5% |
| Max Drawdown | -14.5% |
| 52W Range | 169.89 ~ 375.25 |
| SMA20/60/120 | 349.41 / 303.09 / 281.66 |
| RSI(14) | 40.0 |
| Support/Resistance | 286.41 / 375.25 |
| Revenue Growth | 10.5% |
| Operating Margin | 43.4% |
| ROE | 19.1% |
| D/E | 2.94 |
| P/E / P/B | 13.9 / 2.3 |
| Dividend Yield | 3.3% |
Dividend (History & Sustainability)
Current sustainability assessment: Caution.
| Year | DPS | Payout Ratio |
|---|---|---|
| 2022 | 0.40 | 50.3% |
| 2023 | 0.68 | 50.3% |
| 2024 | 3.84 | 50.3% |
| 2025 | 11.01 | 50.3% |
| 2026 | 0.00 | 50.3% |
Investor-Style Simulation
| Style | Score(0-100) | Focus | Hypothetical Action |
|---|---|---|---|
| Warren Buffett Lens (Quality & Margin of Safety) | 38.6 | ROE 19.1%, operating margin 43.4%, D/E 2.94, P/E 13.9 | Quality may be acceptable, but valuation cushion looks insufficient now. |
| Peter Lynch Lens (Growth vs Price) | 71.8 | Revenue growth 10.5%, PEG-like 1.32, 6M return 30.9% | Track whether growth narrative keeps converting into quarterly numbers. |
| George Soros Lens (Trend & Reflexivity) | 69.0 | 1M/3M return 3.5%/30.8%, volatility 28.5%, RSI 40.0 | Treat as a fast-reaction zone; lean tactical when catalysts hit. |
Recent News (Sources)
- Credicorp Ltd (BAP) Q4 2025 Earnings Call Highlights: Record High Net Income and Strategic ... (GuruFocus.com, 2026-02-13)
- Credicorp (BAP) Q4 2025 Earnings Call Transcript (Motley Fool, 2026-02-13)
- Credicorp Ltd. Q4 2025 Earnings Call Summary (Moby, 2026-02-13)
Key Risks
Risk management matters more than perfect forecasting. For Credicorp Ltd., this section is less a warning and more a protection framework for position discipline around leverage (D/E 2.94), valuation sensitivity (P/E 13.9), and volatility (28.5%).
- Leverage (D/E 2.94) is elevated, increasing sensitivity to higher rates or refinancing costs.
- Consensus revision direction and management guidance tone can dominate short-term price direction.
- Regulatory, legal, or policy shifts can rapidly reframe valuation assumptions.
- Competitive pressure in core segments may erode share or margin resilience.
Counter-Arguments & Invalidation
- If price remains below support 286.41 for ~2 weeks, current trend thesis weakens.
- If next-quarter revenue growth slows materially below current run-rate, downgrade the base thesis.
- If consensus EPS revisions stay negative for multiple weeks post-earnings, reset scenario weights.
Checklist
Before next event
- Check direction of EPS revisions across the next two quarters (up/down).
- Confirm leverage and cash-flow resilience under slower growth.
- Re-check entry asymmetry around support/resistance and stop distance.
Portfolio memo
Volatility is not extreme, but event windows can still move the tape sharply. In a neutral oscillator zone, conditional entries are more rational than directional impulse bets.
Pre-trade checks
- Have I defined an explicit invalidation price/condition?
- Is my position size consistent with recent volatility?
- Do I have a post-earnings scenario update plan?
- Is downside risk acceptable under the bear case?
Conclusion (Bull / Base / Bear)
| Scenario | Thesis | Trigger | Target Price | Expected Return |
|---|---|---|---|---|
| Bull | Earnings surprise and valuation resilience occur together | Faster revenue growth with upward guidance revisions | 371.98 | 12.8% |
| Base | Results land near consensus while valuation stays neutral | Margin defense with neutral positioning/flow | 332.12 | 0.7% |
| Bear | Growth decelerates and valuation compresses simultaneously | Guidance cuts with higher risk-premium pressure | 272.34 | -17.4% |
The base-path target is 332.12. However, the spread between bull (12.8%) and bear (-17.4%) outcomes is wide, so conditional response matters more than static conviction.
Related Reports
Recent notes from the same market to compare assumptions.
- JPMorgan Chase(JPM) 289.48 | 3M -8.4% | Vol 26.8% | Risk Management Priority Zone (As of: 2026-03-06) (As-of 2026-03-06)
- Broadcom(AVGO) 330.48 | 3M -13.3% | Vol 37.5% | Entry Timing Check Zone (As of: 2026-03-06) (As-of 2026-03-06)
- Meta Platforms(META) 644.86 | 3M -2.5% | Vol 40.0% | Entry Timing Check Zone (As of: 2026-03-06) (As-of 2026-03-06)
- Exxon Mobil(XOM) 151.21 | 3M +29.1% | Vol 28.3% | Entry Timing Check Zone (As of: 2026-03-06) (As-of 2026-03-06)