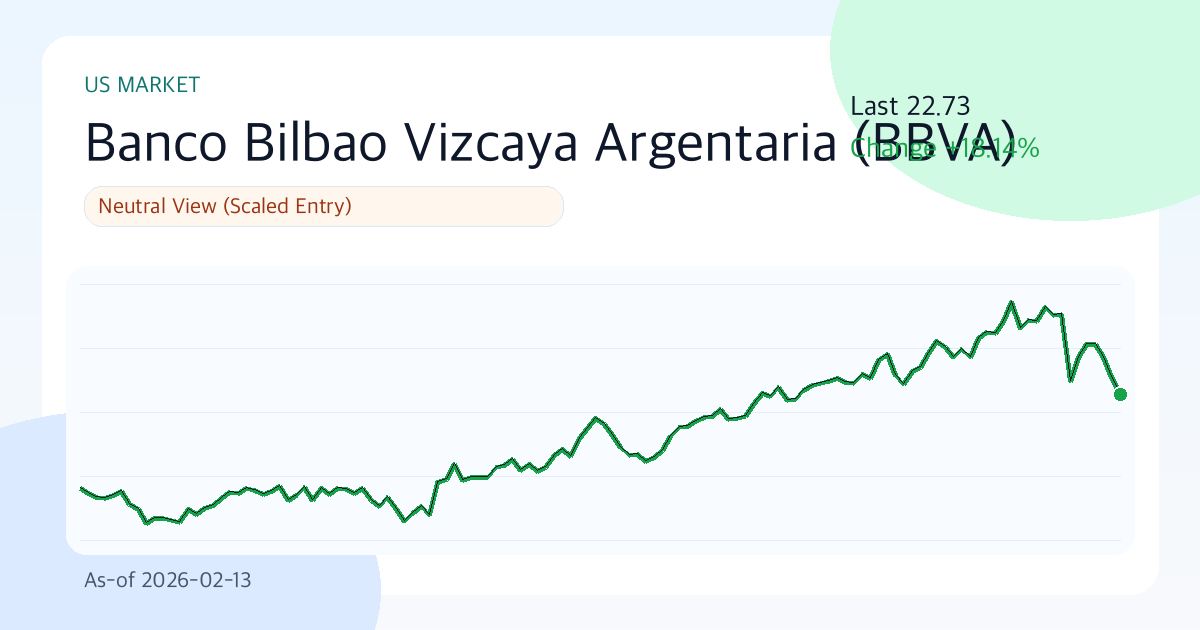
Banco Bilbao Vizcaya Argentaria (BBVA) Stock Price 22.73, Checking the Compass in the Fog (As of: 2026-02-13)
Summary
- One-line judgment: Neutral Outlook (Phased Approach)
- Confidence Level: Moderate
- Comment: Overall score is 66.6/100 (Valuation 67.4, Technical 46.5, Risk 100.0). Current price is 22.73, short-term support/resistance is 22.73/26.11, and the 30-day annualized volatility is 42.3%.
Key Points (3 Lines)
- The key point to watch in this period is whether the price stays above the 20-day moving average (24.73). If it does, short-term supply and demand are likely to be favorable.
- The combination of a 48.9% margin and 18.3% ROE signals that the core business is not weak, but the D/E ratio of 1.21 requires checking sensitivity to interest rates.
- Based on a dividend yield of 3.6% and an average payout ratio of 41.0%, dividend sustainability is rated 'Moderate'.
Opening the chart for Banco Bilbao Vizcaya Argentaria today, the first thing you notice is rhythm rather than numbers. The current phase is neutral, and confidence largely depends on data updates. Therefore, it's more advantageous to pre-determine 'under what conditions the judgment will change' rather than rushing to conclusions.
Investment Thesis (Valuation)
The core judgment leans towards the balance between the quality of earnings and price, rather than complex narratives. If Banco Bilbao Vizcaya Argentaria's earnings quality is maintained and the market price (PER 10.9, PBR 1.9) for those earnings does not collapse excessively, the current valuation will gain explanatory power over time.
The core thesis is whether the combination of 'financial strength (48.9% margin, 18.3% ROE) and current price momentum (5.2% over 3 months)' can create a re-rating in the next 1-2 quarters.
- Growth: Revenue growth rate of -1.9% suggests a potential slowdown in growth.
- Profitability: An operating margin of 48.9% and ROE of 18.3% can be interpreted as potential top-tier performance within the industry.
- Valuation: PER of 10.9 and PBR of 1.9 are classified as neutral to reasonable.
- Capital Return: The combination of an average payout ratio of 41.0% and a dividend yield of 3.6% is positive for shareholder return attractiveness.
Author's View (Personal Opinion)
If it were my preference, I would not rush now and would increase the observation ratio until the numbers are confirmed once more. The combination of recent 3-month returns of 5.2% and volatility of 42.3% shows a period where both 'profit opportunities' and 'speed of loss' are significant. This stock can gain momentum if the direction is right, but conversely, it's important to always remember that recovery time from losses can be long if it's wrong.
Unique Argument of This Article (Basis)
- The primary basis for the current judgment is the supply and demand dynamics created by the recent 3-month return of 5.2% and the price's position above/below the 20-day moving average (24.73).
- Financial strength is assessed by an operating margin of 48.9% and ROE of 18.3%. If both of these values decline simultaneously, the investment thesis quality will rapidly weaken.
- The valuation metrics are PER 10.9 and PBR 1.9. The core of this report is whether 'this valuation is excessive relative to the -1.9% growth rate'.
Technical Analysis
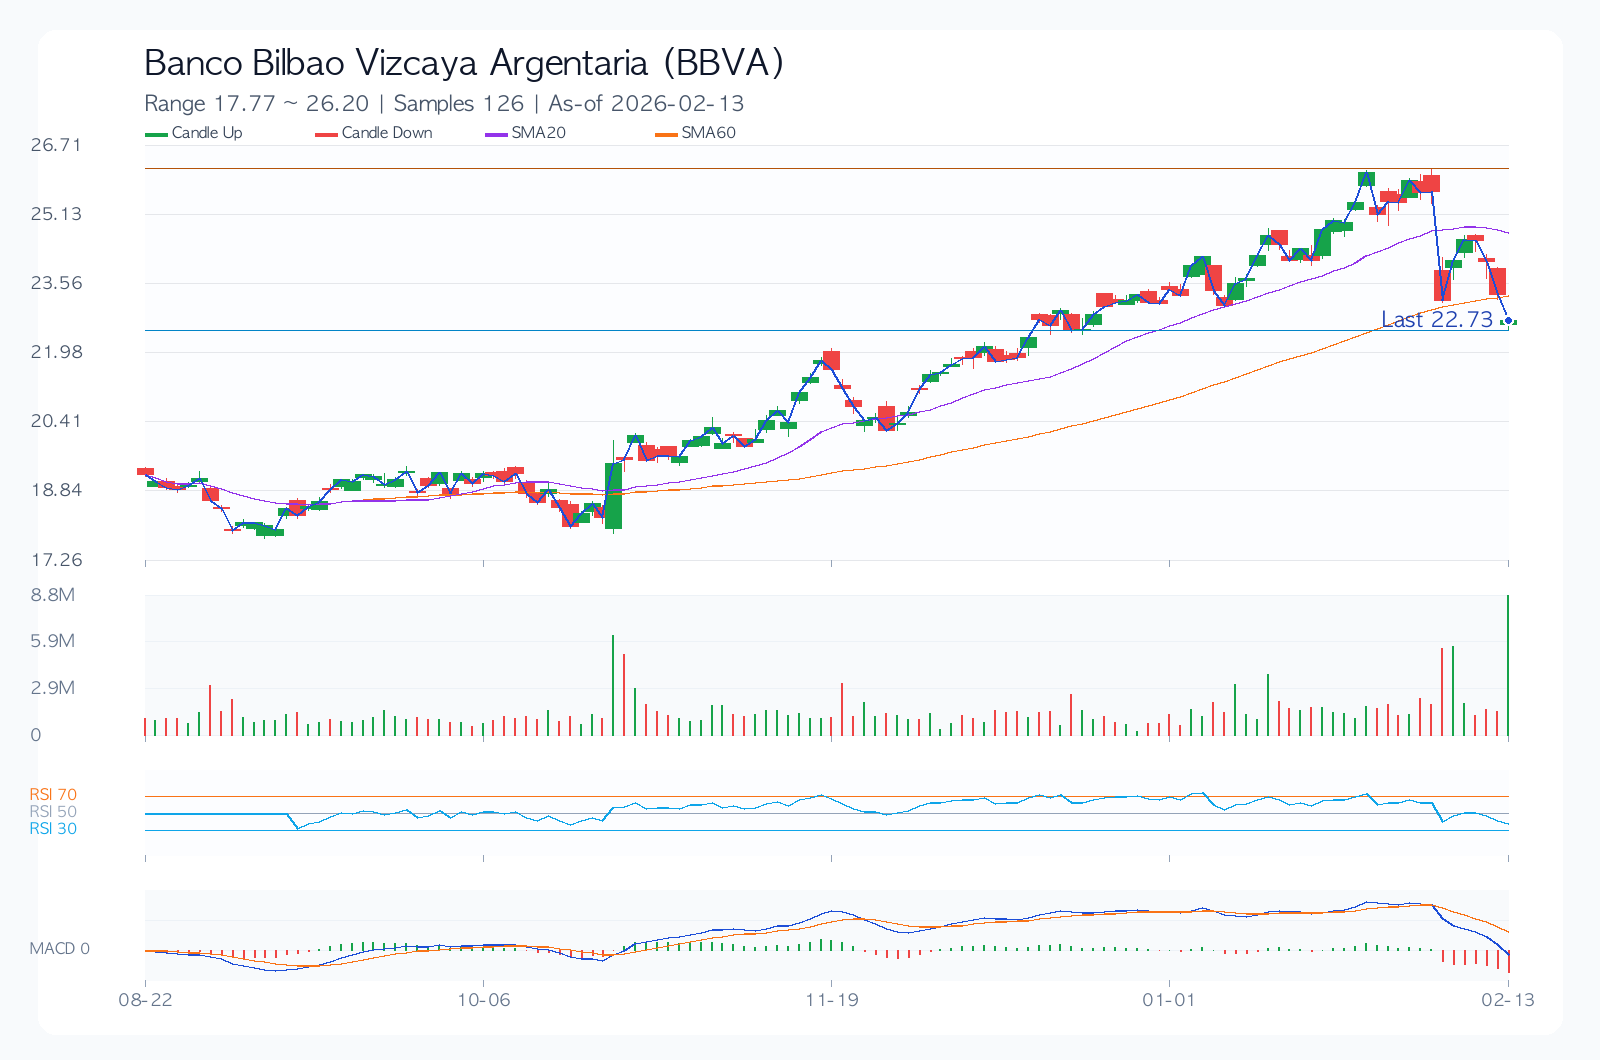
Technically, this is a juncture where conviction and doubt coexist. Therefore, level management (support 22.73 / resistance 26.11) is likely to account for most of the performance, rather than chasing.
- Trend: The 20-day/60-day/120-day moving averages are 24.73/23.30/21.32, respectively, in a positive alignment.
- Momentum: 1-month -5.6%, 3-month 5.2%, 6-month 18.1%, indicating mid-term momentum advantage.
- Overbought/Oversold: RSI(14) is 34.2, in the neutral zone.
- Volatility/Drawdown: 30-day annualized volatility of 42.3% and maximum drawdown of -22.6% should be used as benchmarks for position sizing.
- Price Levels: A trend reversal is likely when the short-term support at 22.73 or resistance at 26.11 is broken or breached.
Desk Memo (Brief Comment)
Today's market is a day where stop-loss rules are needed before coffee. Given the high volatility, simply reducing position size can significantly lower return fluctuations.
Key Chart
Financial Statements and Indicators
| Category | Value |
|---|---|
| Overall Score | 66.6/100 |
| Valuation/Technical/Risk | 67.4 / 46.5 / 100.0 |
| Current Price | 22.73 |
| 1M/3M/6M Returns | -5.7% / 5.2% / 18.1% |
| 30-Day Annualized Volatility | 42.3% |
| Max Drawdown (MDD) | -22.6% |
| 52-Week Range | 11.90 ~ 26.11 |
| 20/60/120-Day Moving Averages | 24.73 / 23.30 / 21.32 |
| RSI(14) | 34.2 |
| Short-Term Support/Resistance | 22.73 / 26.11 |
| Revenue Growth Rate | -1.9% |
| Operating Margin | 48.9% |
| ROE | 18.3% |
| D/E | 1.21 |
| PER / PBR | 10.9 / 1.9 |
| Dividend Yield | 3.6% |
Dividends (History/Sustainability)
More important than the dividend yield itself is whether the policy is maintained even when the economy and earnings falter. The current assessment is 'Moderate'.
| Year | DPS | Payout Ratio |
|---|---|---|
| 2022 | 0.38 | 41.0% |
| 2023 | 0.50 | 41.0% |
| 2024 | 0.75 | 41.0% |
| 2025 | 0.46 | 41.0% |
| 2026 | 0.00 | 41.0% |
Investment Guru Perspective Simulation
The following content is not a reproduction of actual guru trades, but a style simulation applying the core questions of each investment philosophy to current data.
| Perspective | Style Score (0-100) | Current Focus | Hypothetical Action Scenario |
|---|---|---|---|
| Warren Buffett Perspective (Quality/Margin of Safety) | 80.4 | ROE 18.3%, Operating Margin 48.9%, D/E 1.21, PER 10.9 | Assuming business quality is maintained, consider phased buying and long-term holding. |
| Peter Lynch Perspective (Growth/Price Balance) | 0.0 | Revenue Growth Rate -1.9%, PEG Ratio Equivalent 10.88, 6-Month Return 18.1% | Story exists, but growth attractiveness relative to price is weak. |
| George Soros Perspective (Trend/Reaction Speed) | 40.0 | 1M/3M Returns -5.7%/5.2%, Volatility 42.3%, RSI 34.2 | Trend reliability is low, so observe until signals are confirmed; only react when reversal signs appear. |
Recent News (Source Links)
Here are recently confirmed headlines and their original sources.
- Banco Bilbao Vizcaya Argentaria Colombia SA (BOG:BBVACOL) Q4 2025 Earnings Call Highlights: ... (GuruFocus.com, 2026-02-12)
- BBVA Record Profit And Payouts Raise Questions On Valuation And Risks (Simply Wall St., 2026-02-10)
- Zacks.com featured highlights include Alcoa Globe Life, Banco Bilbao Vizcaya Argentaria, The TJX Companies and TE Connectivity (Zacks, 2026-02-12)
Key Risks
More important than a good scenario is how to respond when a bad scenario occurs. For Banco Bilbao Vizcaya Argentaria, the current risk statement is not a warning but a safety net for maintaining positions. In the current phase, changes in valuation metrics (PER 10.9, PBR 1.9) and 30-day annualized volatility (42.3%) can significantly influence the speed of downside risk.
- With annualized volatility at 42.3%, rapid fluctuations are possible before and after events, making stop-loss rules essential.
- Changes in consensus estimates and guidance comments before and after earnings announcements can influence short-term direction.
- Valuation frameworks can change rapidly due to regulatory, litigation, or policy changes (trade/antitrust/financial regulations, etc.).
- Weakening competitive intensity in core businesses could reduce market share and profit margin defense capabilities.
Counterarguments and Invalidation Conditions
The counterargument is that 'valuation burden (PER 10.9, PBR 1.9) or demand slowdown, if confirmed, could lead to a faster adjustment in multiples than earnings improvement.'
- If the price remains below the short-term support level of 22.73 for more than two weeks, the current trend assumption will be invalidated.
- If the next quarter's revenue growth rate slows to below 0.0%, the growth assumption needs re-evaluation.
- If consensus EPS is revised downwards for four consecutive weeks after the earnings announcement, the base scenario will be adjusted downwards.
Checklist
Must-See Before Next Disclosure/Earnings
- Confirm if the revenue growth rate remains above 0.0% in the next quarterly earnings.
- Confirm if the stock price defends the short-term support level of 22.73.
- Confirm if consensus EPS estimates are revised upwards for four consecutive weeks.
Portfolio Management Notes
Due to high volatility, concentrated single-stock positions are not recommended. As it is in a neutral range, an approach that first establishes conditional entry criteria rather than betting on direction is reasonable.
Pre-Decision Check
- Have the direction of consensus EPS for the next two quarters (upward/downward) been confirmed?
- Can the financial structure (D/E, interest coverage, cash flow) withstand an economic slowdown?
- Does the entry price secure a risk-reward ratio of at least 1:2 relative to support/resistance levels?
- Are dividend policies (increase/maintain/decrease) and share buyback policies consistently followed?
- Has the maximum acceptable loss limit in case of a pessimistic scenario been defined in advance?
Conclusion (Optimistic, Base, Pessimistic 3 Scenarios)
| Scenario | Assumption | Key Trigger | Target Price (Model) | Expected Return |
|---|---|---|---|---|
| Optimistic | Simultaneous earnings surprise and multiple defense | Acceleration of revenue growth + upward revision of guidance | 26.66 | 17.3% |
| Base | Earnings meet consensus, multiples remain neutral | Margin defense + neutral supply/demand | 23.80 | 4.7% |
| Pessimistic | Simultaneous earnings slowdown and multiple contraction | Downward revision of guidance + expansion of risk premium | 19.52 | -14.1% |
The target price for the base scenario is 23.80. However, given the wide gap between the optimistic (17.3%) and pessimistic (-14.1%) scenarios, it is reasonable to view this stock as a situation where 'conditional response' is more important than finding the 'correct answer'.
Related Reports
Recent notes from the same market to compare assumptions.
- JPMorgan Chase(JPM) 289.48 | 3M -8.4% | Vol 26.8% | Risk Management Priority Zone (As of: 2026-03-06) (As-of 2026-03-06)
- Broadcom(AVGO) 330.48 | 3M -13.3% | Vol 37.5% | Entry Timing Check Zone (As of: 2026-03-06) (As-of 2026-03-06)
- Meta Platforms(META) 644.86 | 3M -2.5% | Vol 40.0% | Entry Timing Check Zone (As of: 2026-03-06) (As-of 2026-03-06)
- Exxon Mobil(XOM) 151.21 | 3M +29.1% | Vol 28.3% | Entry Timing Check Zone (As of: 2026-03-06) (As-of 2026-03-06)