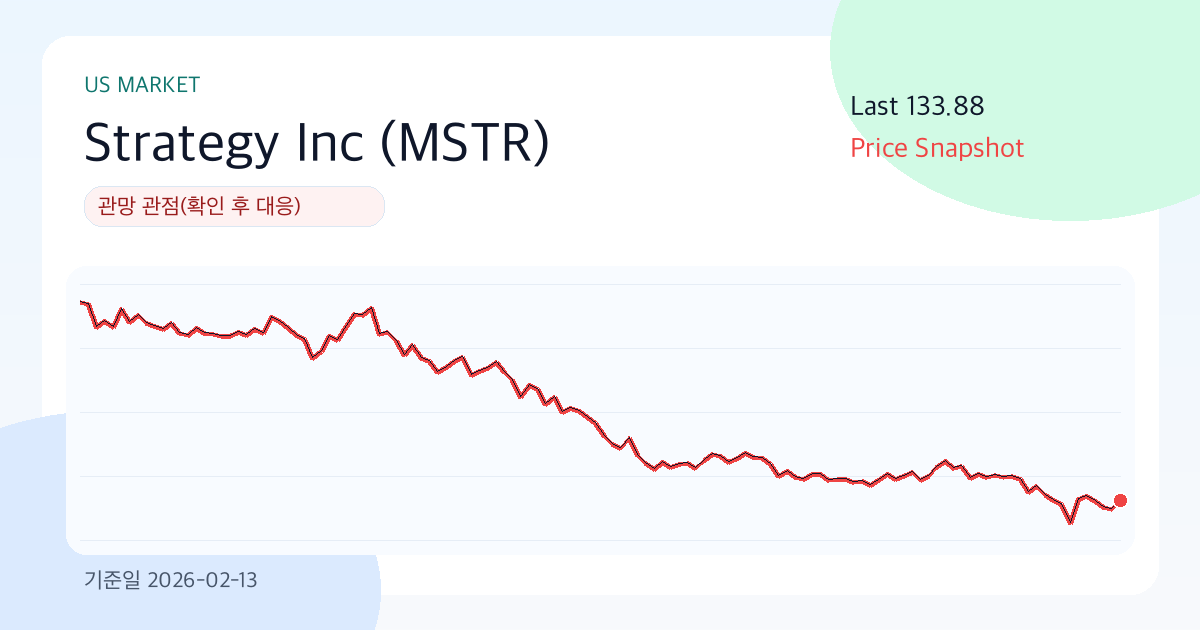
Strategy Inc (MSTR) at 133.88: a thin-ice zone where slower is smarter (As-of: 2026-02-13)
Summary
- View: Watch View (Wait for Confirmation)
- Conviction: Medium
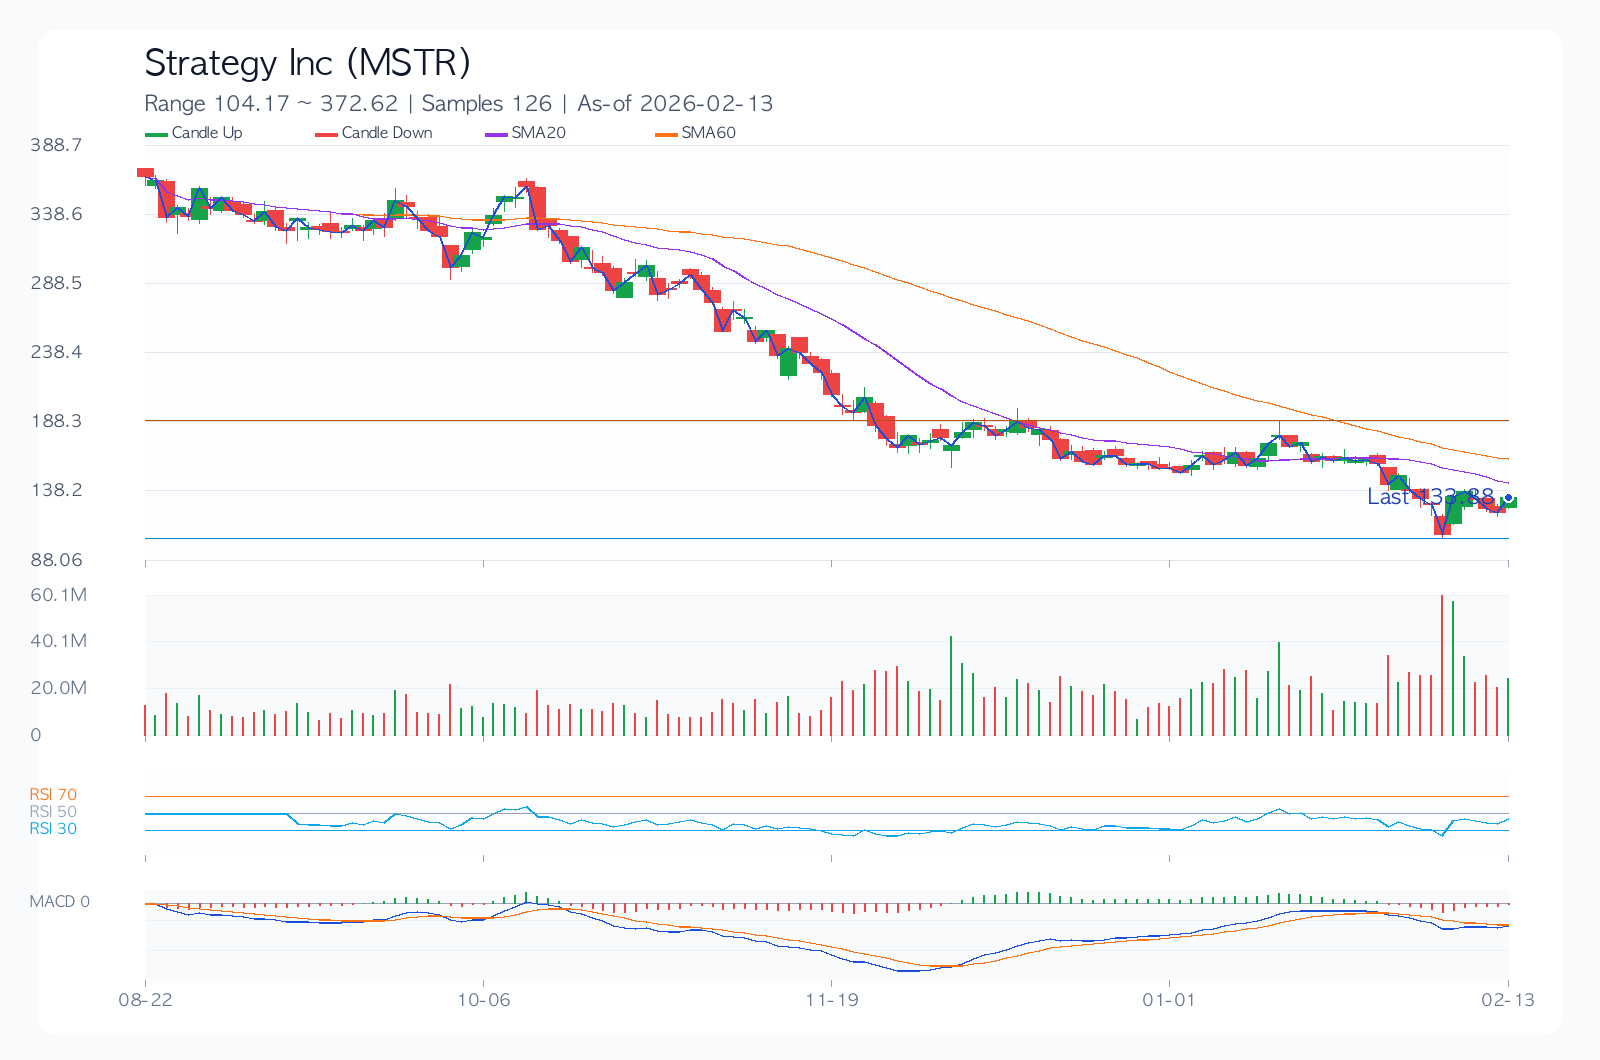
- Comment: Total score 37.0/100 (Value 30.8, Technical 21.5, Risk 78.0). Last 133.88, support/resistance 106.99/179.33, 30D annualized volatility 114.7%.
When we open Strategy Inc's chart today, rhythm matters more than noise. In this phase, headwinds are strong and waves are high, so it is better to define 'what invalidates the view' before making size decisions.
Value Logic
The value case is straightforward. If Strategy Inc sustains earnings quality, and the market's pricing (P/E 1.9, P/B 0.9) does not compress too aggressively, the current valuation can remain explainable over time.
Technical Analysis
Technically, this is a balanced between conviction and doubt zone. That makes level management (support 106.99 / resistance 179.33) more important than emotional entries.
Core Chart
Financial Metrics
| Metric | Value |
|---|---|
| Total Score | 37.0/100 |
| Value/Technical/Risk | 30.8 / 21.5 / 78.0 |
| Last Price | 133.88 |
| 1M/3M/6M Return | -21.7% / -35.8% / -63.5% |
| 30D Annualized Volatility | 114.7% |
| Max Drawdown | -77.4% |
| 52W Range | 106.99 ~ 455.90 |
| SMA20/60/120 | 144.68 / 162.15 / 232.49 |
| RSI(14) | 39.4 |
| Support/Resistance | 106.99 / 179.33 |
| Revenue Growth | 1.9% |
| Operating Margin | -14184.9% |
| ROE | -11.1% |
| D/E | 0.19 |
| P/E / P/B | 1.9 / 0.9 |
| Dividend Yield | 0.0% |
Dividend (History & Sustainability)
Current sustainability assessment: Moderate.
| Year | DPS | Payout Ratio |
|---|---|---|
| 2022 | 0.00 | 0.0% |
| 2023 | 0.00 | 0.0% |
| 2024 | 0.00 | 0.0% |
| 2025 | 0.00 | 0.0% |
| 2026 | 0.00 | 0.0% |
Key Risks
Risk management matters more than perfect forecasting. For Strategy Inc, this section is less a warning and more a protection framework for position discipline around leverage (D/E 0.19), valuation sensitivity (P/E 1.9), and volatility (114.7%).
- 30D annualized volatility at 114.7% implies larger event-driven swings; stop discipline is required.
- Lower operating margin can weaken earnings defense under input-cost pressure or pricing competition.
- Historical max drawdown (-77.4%) indicates downside can extend quickly in renewed selloffs.
- Consensus revision direction and management guidance tone can dominate short-term price direction.
- Regulatory, legal, or policy shifts can rapidly reframe valuation assumptions.
Conclusion (Bull / Base / Bear)
| Scenario | Thesis | Trigger | Target Price | Expected Return |
|---|---|---|---|---|
| Bull | Earnings surprise and valuation resilience occur together | Faster revenue growth with upward guidance revisions | 131.95 | -1.4% |
| Base | Results land near consensus while valuation stays neutral | Margin defense with neutral positioning/flow | 117.81 | -12.0% |
| Bear | Growth decelerates and valuation compresses simultaneously | Guidance cuts with higher risk-premium pressure | 96.61 | -27.8% |
The base-path target is 117.81. However, the spread between bull (-1.4%) and bear (-27.8%) outcomes is wide, so conditional response matters more than static conviction.
Related Reports
Recent notes from the same market to compare assumptions.
- JPMorgan Chase(JPM) 289.48 | 3M -8.4% | Vol 26.8% | Risk Management Priority Zone (As of: 2026-03-06) (As-of 2026-03-06)
- Broadcom(AVGO) 330.48 | 3M -13.3% | Vol 37.5% | Entry Timing Check Zone (As of: 2026-03-06) (As-of 2026-03-06)
- Meta Platforms(META) 644.86 | 3M -2.5% | Vol 40.0% | Entry Timing Check Zone (As of: 2026-03-06) (As-of 2026-03-06)
- Exxon Mobil(XOM) 151.21 | 3M +29.1% | Vol 28.3% | Entry Timing Check Zone (As of: 2026-03-06) (As-of 2026-03-06)