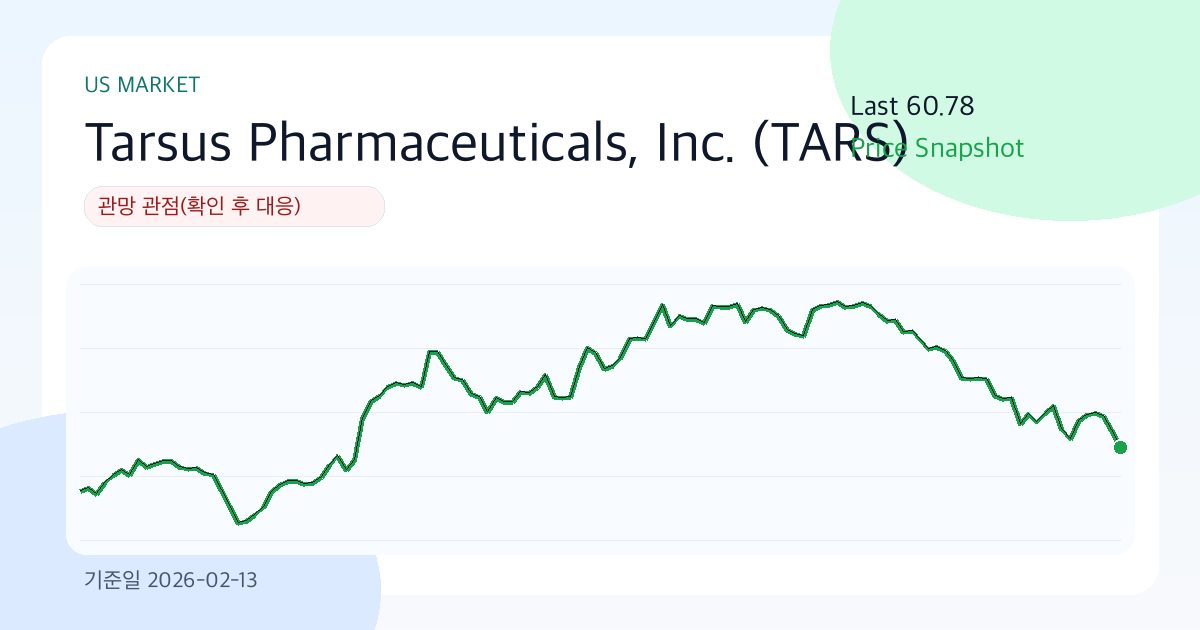
Tarsus Pharmaceuticals, Inc. (TARS) at 60.78: a thin-ice zone where slower is smarter (As-of: 2026-02-13)
Summary
- View: Watch View (Wait for Confirmation)
- Conviction: Medium
- Comment: Total score 45.4/100 (Value 43.1, Technical 30.9, Risk 76.0). Last 60.78, support/resistance 60.78/80.77, 30D annualized volatility 34.9%.
When we open Tarsus Pharmaceuticals, Inc.'s chart today, rhythm matters more than noise. In this phase, headwinds are strong and waves are high, so it is better to define 'what invalidates the view' before making size decisions.
Value Logic
The value case is straightforward. If Tarsus Pharmaceuticals, Inc. sustains earnings quality, and the market's pricing (P/E 44.3, P/B 7.7) does not compress too aggressively, the current valuation can remain explainable over time.
Editor's View
Personally, I would avoid aggressive bets in this zone; good business and good entry are not always the same. The mix of 3M return -16.2% and 30D annualized volatility 34.9% suggests both opportunity and loss-speed are elevated. If direction is right, momentum can accelerate fast; if wrong, recovery time can be longer than expected.
Technical Analysis
Technically, this is a balanced between conviction and doubt zone. That makes level management (support 60.78 / resistance 80.77) more important than emotional entries.
Desk Note
Not a dramatic tape, but these ordinary sessions are where disciplined process compounds.
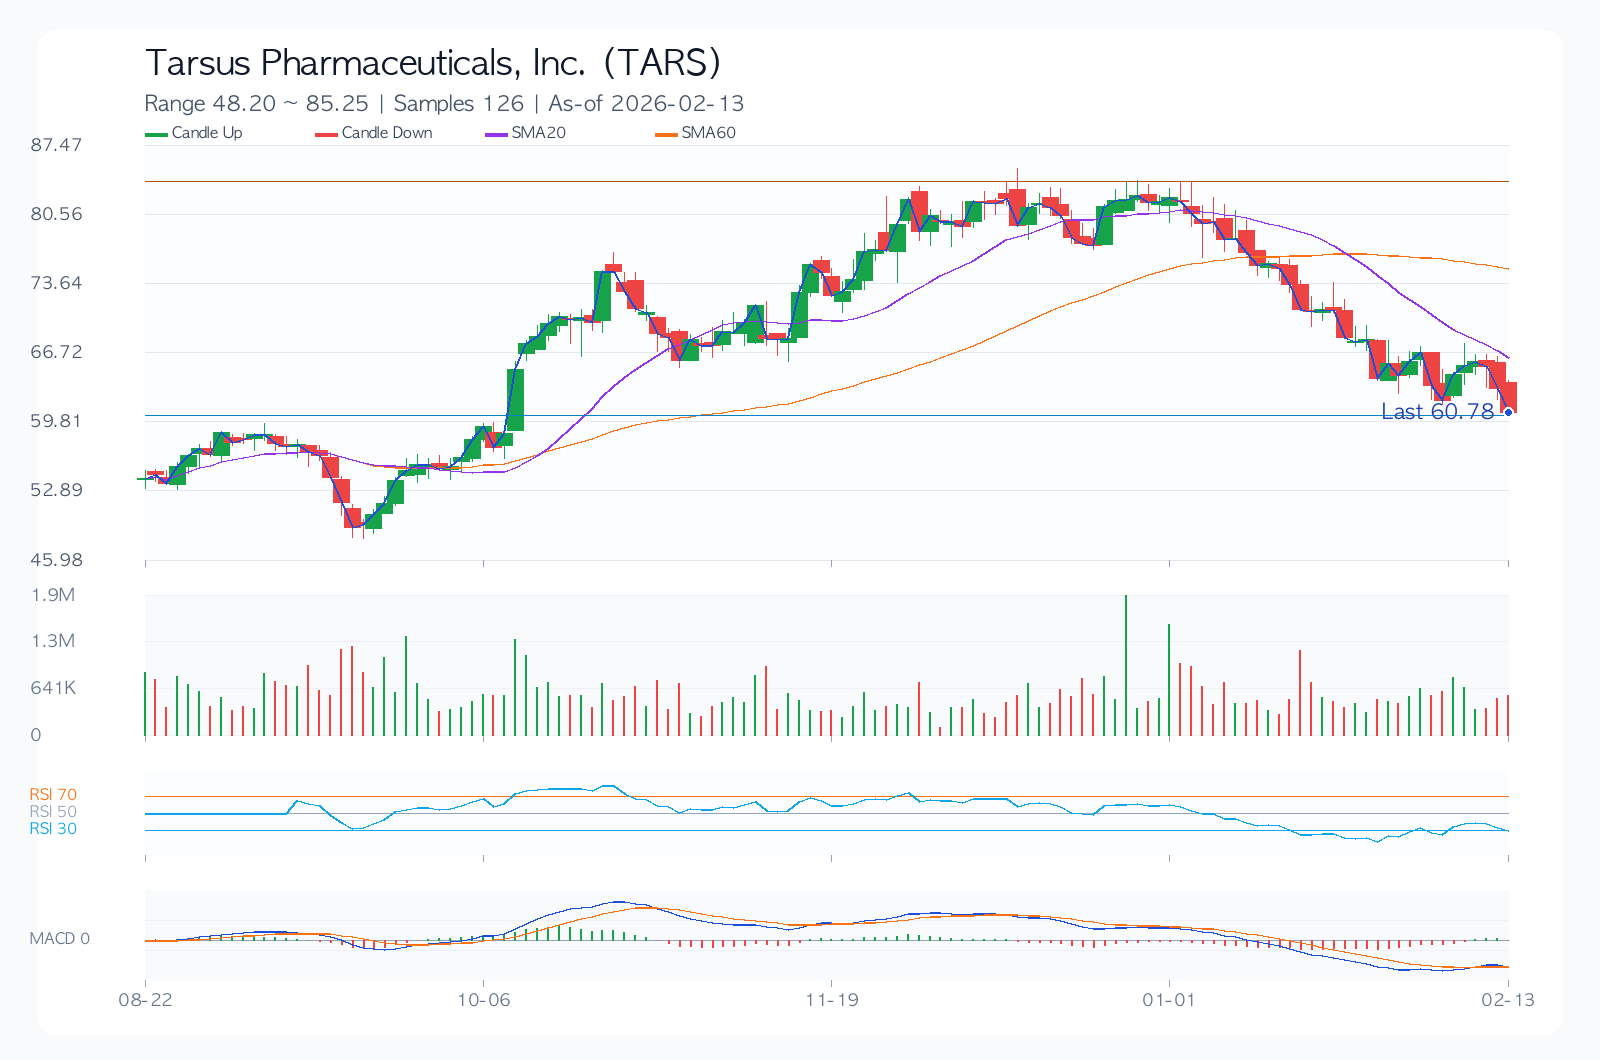
Core Chart
Financial Metrics
| Metric | Value |
|---|---|
| Total Score | 45.4/100 |
| Value/Technical/Risk | 43.1 / 30.9 / 76.0 |
| Last Price | 60.78 |
| 1M/3M/6M Return | -17.5% / -16.2% / 12.1% |
| 30D Annualized Volatility | 34.9% |
| Max Drawdown | -45.1% |
| 52W Range | 38.82 ~ 82.51 |
| SMA20/60/120 | 66.34 / 75.23 / 69.39 |
| RSI(14) | 34.5 |
| Support/Resistance | 60.78 / 80.77 |
| Revenue Growth | 146.7% |
| Operating Margin | -12.2% |
| ROE | -28.4% |
| D/E | 0.25 |
| P/E / P/B | 44.3 / 7.7 |
| Dividend Yield | 0.0% |
Dividend (History & Sustainability)
Current sustainability assessment: Moderate.
| Year | DPS | Payout Ratio |
|---|---|---|
| 2022 | 0.00 | 0.0% |
| 2023 | 0.00 | 0.0% |
| 2024 | 0.00 | 0.0% |
| 2025 | 0.00 | 0.0% |
| 2026 | 0.00 | 0.0% |
Investor-Style Simulation
| Style | Score(0-100) | Focus | Hypothetical Action |
|---|---|---|---|
| Warren Buffett Lens (Quality & Margin of Safety) | 0.0 | ROE -28.4%, operating margin -12.2%, D/E 0.25, P/E 44.3 | Quality may be acceptable, but valuation cushion looks insufficient now. |
| Peter Lynch Lens (Growth vs Price) | 100.0 | Revenue growth 146.7%, PEG-like 0.30, 6M return 12.1% | Track whether growth narrative keeps converting into quarterly numbers. |
| George Soros Lens (Trend & Reflexivity) | 16.2 | 1M/3M return -17.5%/-16.2%, volatility 34.9%, RSI 34.5 | Trend reliability is low; wait for clearer reversal evidence. |
Recent News (Sources)
- While shareholders of Tarsus Pharmaceuticals (NASDAQ:TARS) are in the black over 3 years, those who bought a week ago aren't so fortunate (Simply Wall St., 2026-01-15)
- BMRN or TARS: Which Is the Better Value Stock Right Now? (Zacks, 2026-01-13)
- Can Tarsus Pharmaceuticals Stock Still Offer Value After Its 48% 2025 Rally? (Simply Wall St., 2025-12-05)
Key Risks
Risk management matters more than perfect forecasting. For Tarsus Pharmaceuticals, Inc., this section is less a warning and more a protection framework for position discipline around leverage (D/E 0.25), valuation sensitivity (P/E 44.3), and volatility (34.9%).
- At P/E 44.3, valuation is vulnerable to multiple compression if earnings disappoint.
- Lower operating margin can weaken earnings defense under input-cost pressure or pricing competition.
- Historical max drawdown (-45.1%) indicates downside can extend quickly in renewed selloffs.
- Consensus revision direction and management guidance tone can dominate short-term price direction.
- Regulatory, legal, or policy shifts can rapidly reframe valuation assumptions.
Counter-Arguments & Invalidation
- If price remains below support 60.78 for ~2 weeks, current trend thesis weakens.
- If next-quarter revenue growth slows materially below current run-rate, downgrade the base thesis.
- If consensus EPS revisions stay negative for multiple weeks post-earnings, reset scenario weights.
Checklist
Before next event
- Check direction of EPS revisions across the next two quarters (up/down).
- Confirm leverage and cash-flow resilience under slower growth.
- Re-check entry asymmetry around support/resistance and stop distance.
Portfolio memo
Volatility is not extreme, but event windows can still move the tape sharply. In a neutral oscillator zone, conditional entries are more rational than directional impulse bets.
Pre-trade checks
- [ ] Have I defined an explicit invalidation price/condition?
- [ ] Is my position size consistent with recent volatility?
- [ ] Do I have a post-earnings scenario update plan?
- [ ] Is downside risk acceptable under the bear case?
Conclusion (Bull / Base / Bear)
| Scenario | Thesis | Trigger | Target Price | Expected Return |
|---|---|---|---|---|
| Bull | Earnings surprise and valuation resilience occur together | Faster revenue growth with upward guidance revisions | 61.45 | 1.1% |
| Base | Results land near consensus while valuation stays neutral | Margin defense with neutral positioning/flow | 54.87 | -9.7% |
| Bear | Growth decelerates and valuation compresses simultaneously | Guidance cuts with higher risk-premium pressure | 44.99 | -26.0% |
The base-path target is 54.87. However, the spread between bull (1.1%) and bear (-26.0%) outcomes is wide, so conditional response matters more than static conviction.
Related Reports
Recent notes from the same market to compare assumptions.
- JPMorgan Chase(JPM) 289.48 | 3M -8.4% | Vol 26.8% | Risk Management Priority Zone (As of: 2026-03-06) (As-of 2026-03-06)
- Broadcom(AVGO) 330.48 | 3M -13.3% | Vol 37.5% | Entry Timing Check Zone (As of: 2026-03-06) (As-of 2026-03-06)
- Meta Platforms(META) 644.86 | 3M -2.5% | Vol 40.0% | Entry Timing Check Zone (As of: 2026-03-06) (As-of 2026-03-06)
- Exxon Mobil(XOM) 151.21 | 3M +29.1% | Vol 28.3% | Entry Timing Check Zone (As of: 2026-03-06) (As-of 2026-03-06)