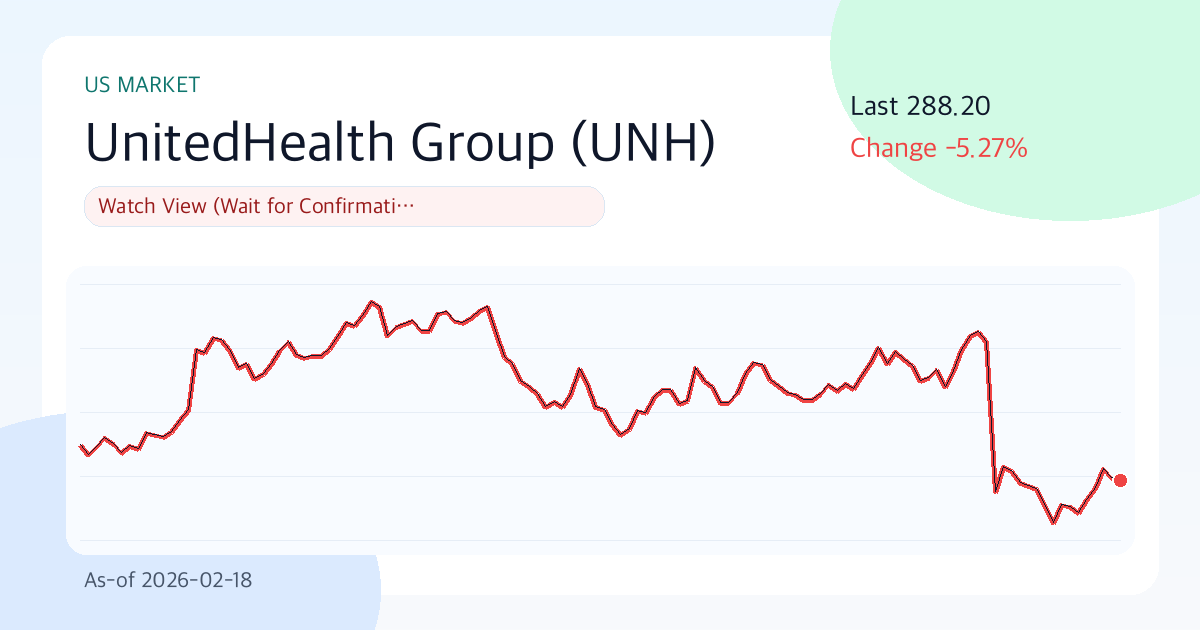
UnitedHealth Group (UNH) 288.20 | 3M -10.1% | Vol 63.8% | Risk Control Priority Zone (As-of: 2026-02-18)
Summary
- View: Watch View (Wait for Confirmation)
- Conviction: Medium
- Comment: Total score 50.9/100 (Value 55.7, Technical 29.3, Risk 78.0). Last 288.20, support/resistance 268.55/356.26, 30D annualized volatility 63.8%.
When we open UnitedHealth Group's chart today, rhythm matters more than noise. In this phase, headwinds are strong and waves are high, so it is better to define 'what invalidates the view' before making size decisions.
Value Logic
The value case is straightforward. If UnitedHealth Group sustains earnings quality, and the market's pricing (P/E 21.8, P/B 2.6) does not compress too aggressively, the current valuation can remain explainable over time.
- Growth: revenue growth at 12.3% suggests ongoing expansion.
- Profitability: operating margin 0.3% and ROE 12.5% indicate mid-range quality.
- Valuation: P/E 21.8, P/B 2.6 places the stock in a neutral-to-reasonable zone.
- Shareholder return: average payout and dividend profile support a moderate sustainability view.
Core Claims
- Primary signal comes from 3M return (-10.1%) and location vs SMA20 (296.98).
- Business health checkpoints are operating margin (0.3%) and ROE (12.5%).
- Valuation axis is P/E 21.8, P/B 2.6, versus growth 12.3%.
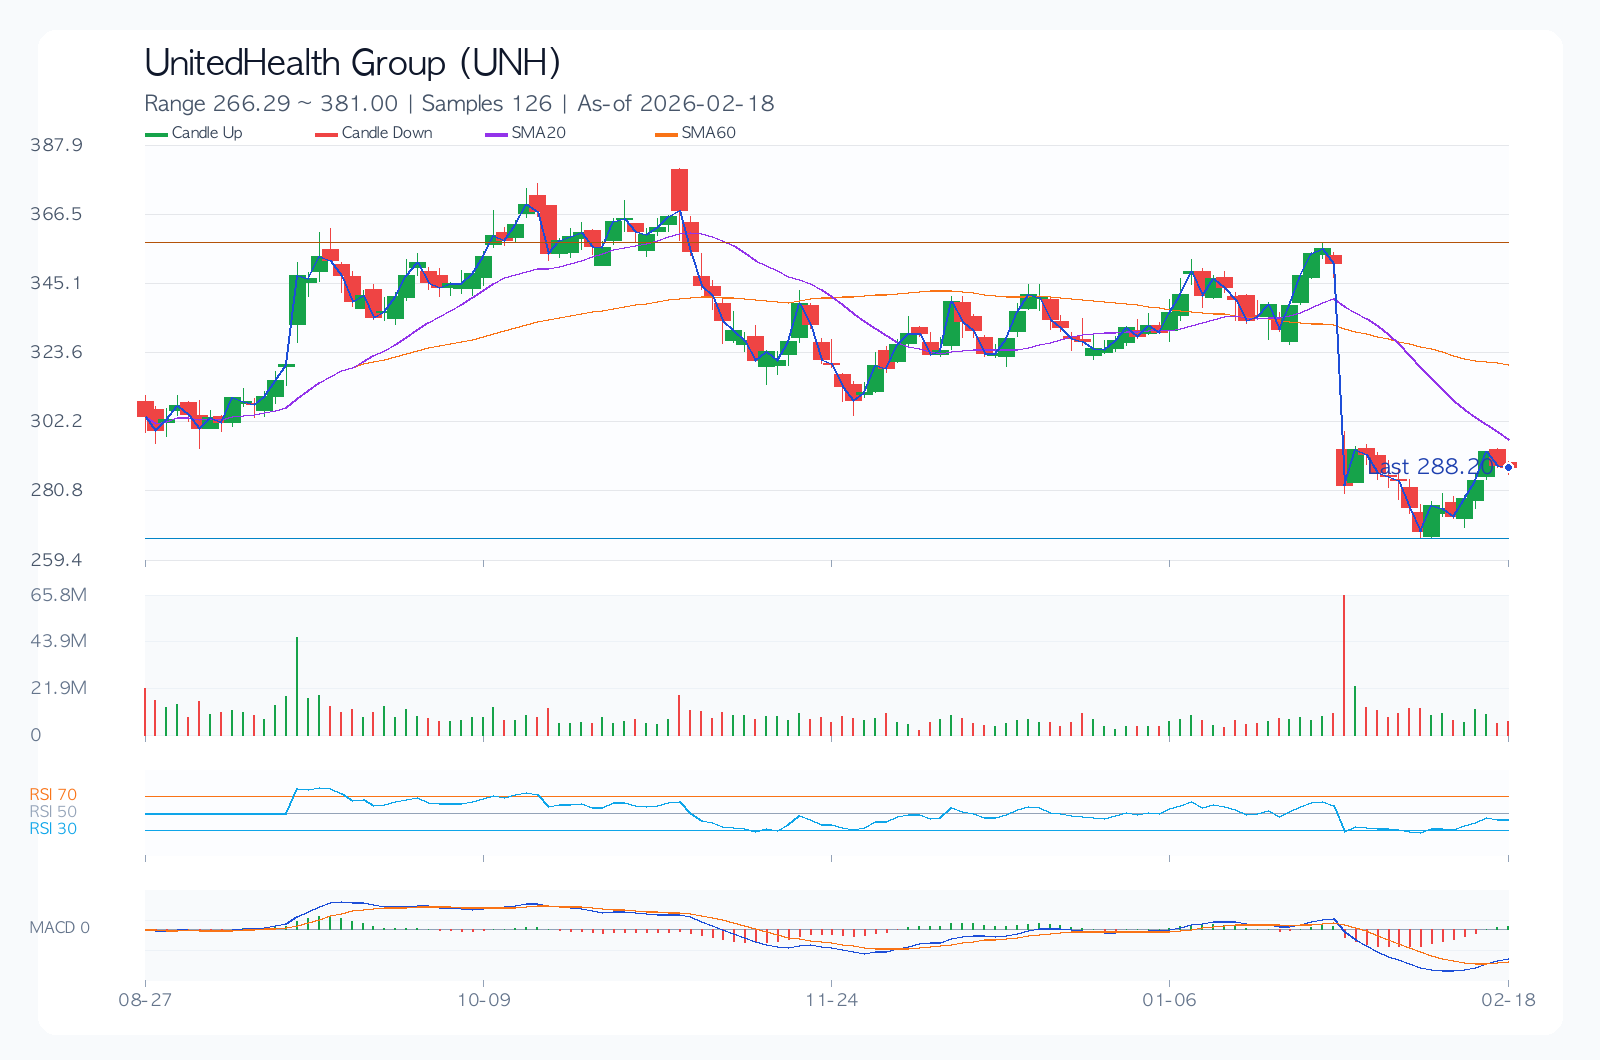
Technical Analysis
Technically, this is a balanced between conviction and doubt zone. That makes level management (support 268.55 / resistance 356.26) more important than emotional entries.
- Trend: SMA20/60/120 = 296.98/320.38/330.89, currently mixed or weakly stacked.
- Momentum: 1M -14.8%, 3M -10.1%, 6M -5.3%.
- Oscillator: RSI(14) 45.3, neutral.
- Risk amplitude: 30D annualized volatility 63.8%, max drawdown -62.0%.
- Levels: support 268.55, resistance 356.26.
Desk Note
Today is one of those sessions where stop rules matter more than coffee. Volatility is high, so position sizing does most of the risk work.
Core Chart
Financial Metrics
| Metric | Value |
|---|---|
| Total Score | 50.9/100 |
| Value/Technical/Risk | 55.7 / 29.3 / 78.0 |
| Last Price | 288.20 |
| 1M/3M/6M Return | -14.8% / -10.1% / -5.3% |
| 30D Ann. Volatility | 63.8% |
| Max Drawdown | -62.0% |
| 52W Range | 237.77 ~ 599.47 |
| SMA20/60/120 | 296.98 / 320.38 / 330.89 |
| RSI(14) | 45.3 |
| Support/Resistance | 268.55 / 356.26 |
| Revenue Growth | 12.3% |
| Operating Margin | 0.3% |
| ROE | 12.5% |
| D/E | 0.79 |
| P/E / P/B | 21.8 / 2.6 |
| Dividend Yield | 3.1% |
Dividend (History & Sustainability)
Current sustainability assessment: Moderate.
| Year | DPS | Payout Ratio |
|---|---|---|
| 2022 | 6.40 | 66.0% |
| 2023 | 7.29 | 66.0% |
| 2024 | 8.18 | 66.0% |
| 2025 | 8.73 | 66.0% |
Investor-Style Simulation
| Style | Score(0-100) | What It Focuses On | Hypothetical Action |
|---|---|---|---|
| Warren Buffett Lens (Quality & Margin of Safety) | 33.4 | ROE 12.5%, operating margin 0.3%, D/E 0.79, P/E 21.8 | Quality may be acceptable, but valuation cushion looks insufficient now. |
| Peter Lynch Lens (Growth vs Price) | 58.1 | Revenue growth 12.3%, PEG-like 1.77, 6M return -5.3% | Use a small tracking position until growth persistence is confirmed. |
| George Soros Lens (Trend & Reflexivity) | 8.7 | 1M/3M return -14.8%/-10.1%, volatility 63.8%, RSI 45.3 | Trend reliability is low; wait for clearer reversal evidence. |
Key Risks
Risk management matters more than perfect forecasting. For UnitedHealth Group, this section is less a warning and more a protection framework for position discipline around leverage (D/E 0.79), valuation sensitivity (P/E 21.8), and volatility (63.8%).
- 30D annualized volatility at 63.8% implies larger event-driven swings; stop discipline is required.
- Lower operating margin can weaken earnings defense under input-cost pressure or pricing competition.
- Historical max drawdown (-62.0%) indicates downside can extend quickly in renewed selloffs.
- Consensus revision direction and management guidance tone can dominate short-term price direction.
- Regulatory, legal, or policy shifts can rapidly reframe valuation assumptions.
Counter-Arguments & Invalidation
- If price remains below support 268.55 for ~2 weeks, current trend thesis weakens.
- If next-quarter revenue growth slows materially below current run-rate, base thesis should be downgraded.
- If consensus EPS revisions stay negative for multiple weeks post-earnings, scenario weights should be reset.
Checklist
Before the next earnings/event
- Check next two quarters of EPS revision direction (up/down).
- Confirm leverage and cash-flow resilience under slower growth.
- Re-check entry asymmetry around support/resistance and stop distance.
Portfolio operation memo
Volatility is high; concentrated single-name exposure is not preferred. In a neutral oscillator zone, conditional entries are more rational than directional impulse bets.
Pre-trade checks
- Have I defined an explicit invalidation price/condition?
- Is my position size consistent with recent volatility?
- Do I have a post-earnings scenario update plan?
- Is downside risk acceptable under the bear case?
Conclusion (Bull / Base / Bear)
| Scenario | Thesis | Trigger | Target Price | Expected Return |
|---|---|---|---|---|
| Bull | Earnings surprise and valuation resilience occur together | Faster revenue growth with upward guidance revisions | 304.07 | 5.5% |
| Base | Results land near consensus while valuation stays neutral | Margin defense with neutral positioning/flow | 271.49 | -5.8% |
| Bear | Growth decelerates and valuation compresses simultaneously | Guidance cuts with higher risk-premium pressure | 222.62 | -22.8% |
The base-path target is 271.49. However, the spread between bull (5.5%) and bear (-22.8%) outcomes is wide, so conditional response matters more than static conviction.
Data Sources
- Data as-of date:
2026-02-18 - Report date:
2026-02-19 - Quote reference: https://finance.yahoo.com/quote/UNH
- Source feeds: Yahoo Finance Price/Quote
Related Reports
Recent notes from the same market to compare assumptions.
- JPMorgan Chase(JPM) 289.48 | 3M -8.4% | Vol 26.8% | Risk Management Priority Zone (As of: 2026-03-06) (As-of 2026-03-06)
- Broadcom(AVGO) 330.48 | 3M -13.3% | Vol 37.5% | Entry Timing Check Zone (As of: 2026-03-06) (As-of 2026-03-06)
- Meta Platforms(META) 644.86 | 3M -2.5% | Vol 40.0% | Entry Timing Check Zone (As of: 2026-03-06) (As-of 2026-03-06)
- Exxon Mobil(XOM) 151.21 | 3M +29.1% | Vol 28.3% | Entry Timing Check Zone (As of: 2026-03-06) (As-of 2026-03-06)