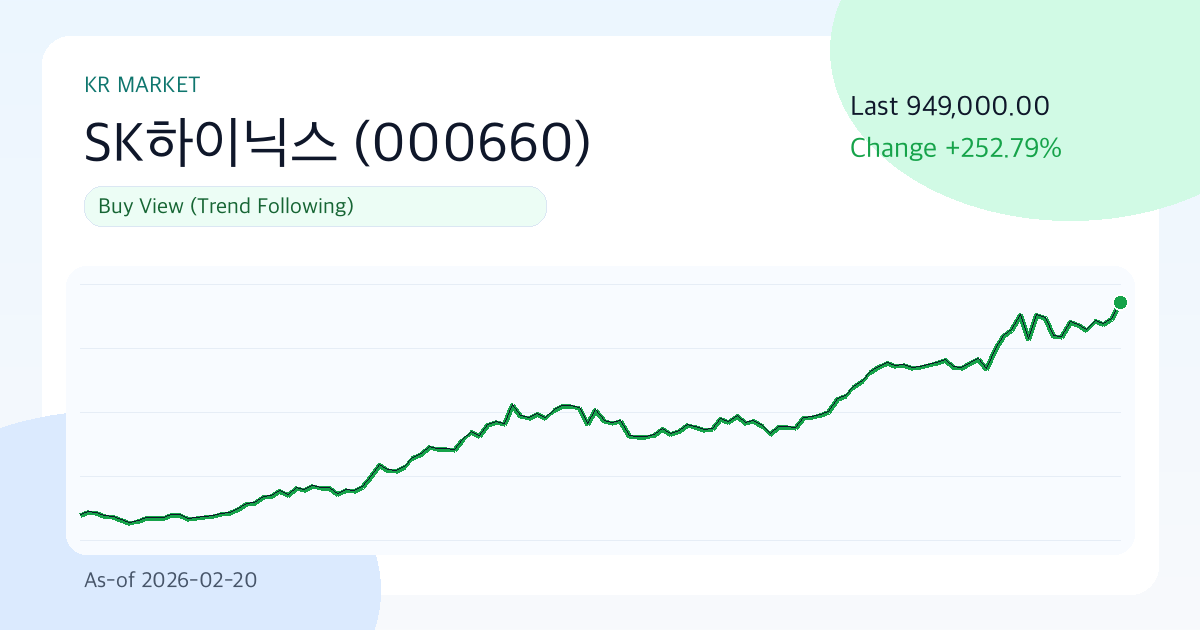
SK Hynix (000660) 949000.00 | 3M +66.5% | Vol 61.5% | Momentum Check Phase (As of: 2026-02-20)
Summary
- One-Line Judgment: Buy (Trend Following)
- Confidence Level: Moderate
- Comment: SK Hynix currently has a composite score of 84.6 points. While it shows a 3-month upward momentum of 66.5%, the high volatility of 61.5% requires caution. A strategy that clearly defines 'judgment criteria' rather than rushing to conclusions is advisable in this phase.
Key Points (3 Lines)
- The key point to watch in this phase is whether the price remains above the 20-day moving average (848050.00). If it does, short-term supply and demand are likely to be favorable.
- The combination of a 58.4% margin and 49.4% ROE signals that the core business strength is not weak. However, with a D/E ratio of 0.18, interest rate sensitivity needs to be checked concurrently.
- Based on a dividend yield of 0.3% and an average dividend payout ratio of 4.1%, dividend sustainability is assessed as 'Good'.
Looking at SK Hynix's chart, it's time to focus on the rhythm rather than just the numbers. Confidence depends on data updates, so it's more advantageous to first determine 'under what conditions the judgment will change' rather than rushing to conclusions.
Investment Thesis (Value)
The key in this phase is whether growth and profitability are maintained simultaneously. If SK Hynix's earnings quality holds and the market's valuation (PER 5.2, PBR 2.0) is not excessively adjusted, the current valuation will gain justification over time.
The core question is whether the 'financial strength (operating profit margin 58.4%, ROE 49.4%) combined with current price momentum (3-month 66.5%) can lead to a re-rating in the next 1-2 quarters.'
- Growth: A revenue growth rate of 66.1% indicates an expansion phase.
- Profitability: An operating profit margin of 58.4% and ROE of 49.4% can be interpreted as top-tier within the industry.
- Valuation: PER 5.2 and PBR 2.0 are classified as neutral to reasonable in the current market environment.
- Shareholder Returns: The combination of an average dividend payout ratio of 4.1% and a dividend yield of 0.3% limits shareholder return attractiveness.
Unique Argument of This Report (Basis)
- The primary basis for the current judgment is the supply and demand directionality created by the recent 3-month return of 66.5% and the price's position relative to the 20-day moving average (848050.00).
- Financial strength is assessed by operating profit margin of 58.4% and ROE of 49.4%; if both of these values decline simultaneously, the investment thesis quality will rapidly weaken.
- The valuation metrics are PER 5.2 and PBR 2.0, and the core of this report is whether 'this valuation is excessive compared to the growth rate of 66.1%'.
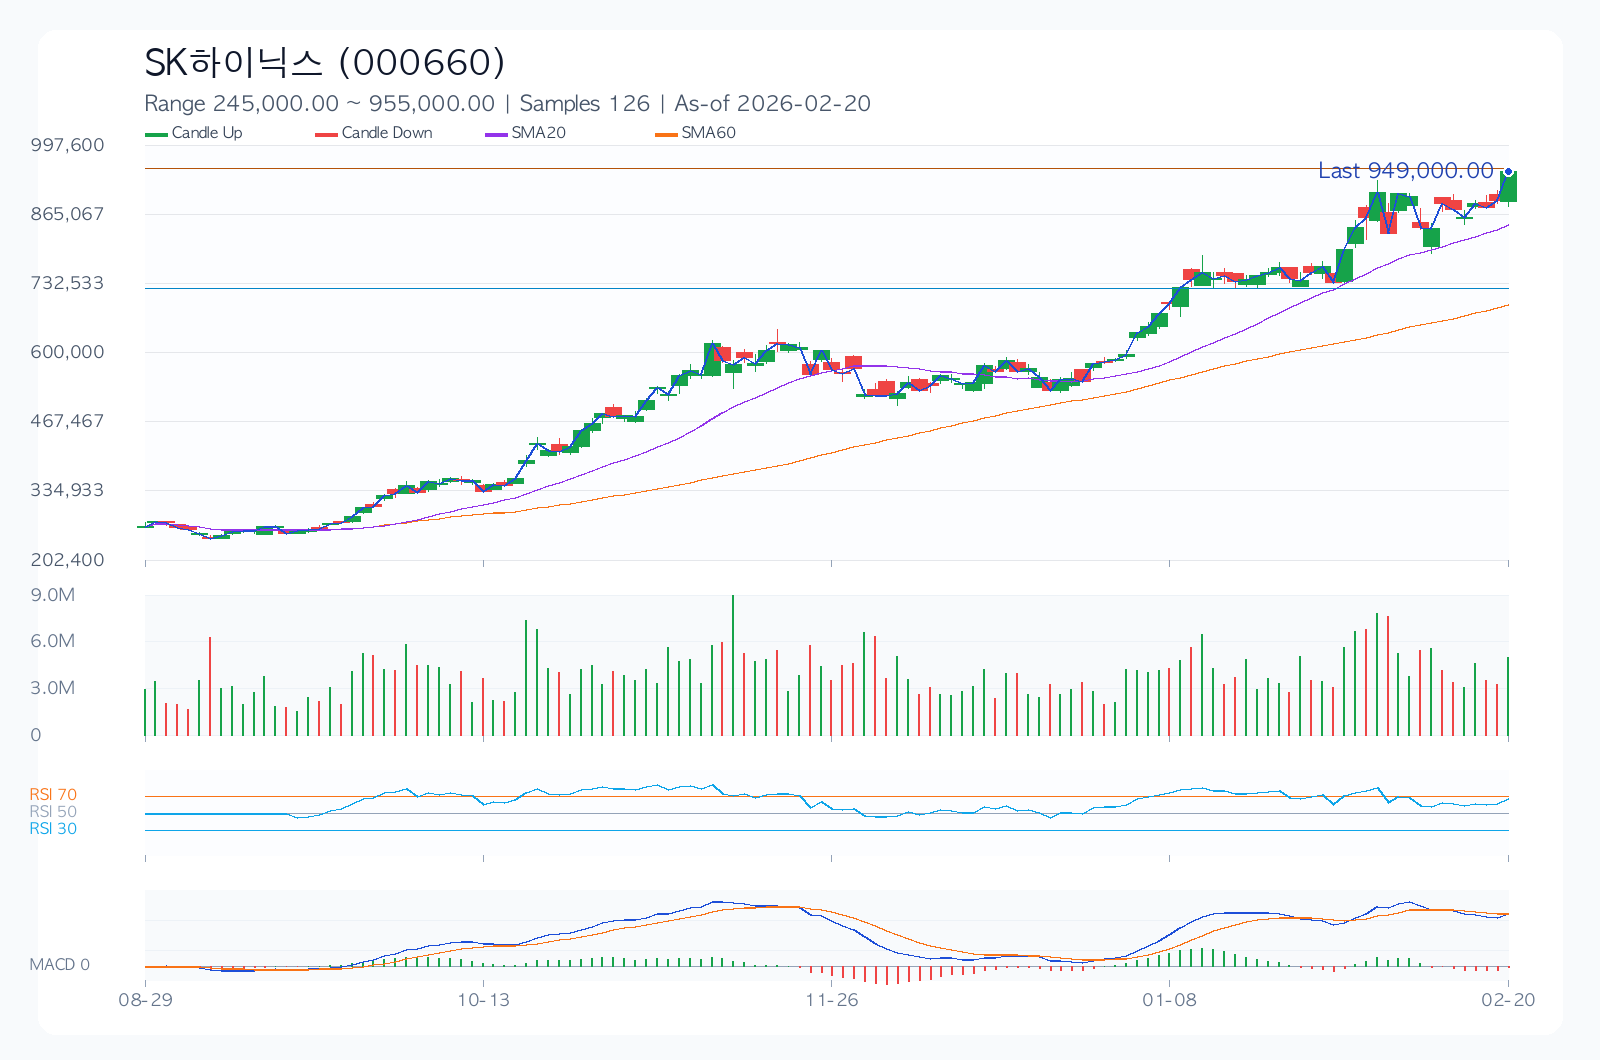
Technical Analysis
Technically, this is a position where conviction and doubt coexist. Therefore, level management (support 736000.00 / resistance 949000.00) is likely to account for most of the performance, rather than chasing the trend.
- Trend: The 20/60/120-day moving averages (848050.00/694616.67/557900.00) are in a positive upward trend.
- Momentum: With 1-month 27.7%, 3-month 66.5%, and 6-month 252.8% returns, mid-term momentum shows strength.
- Overbought/Oversold: RSI(14) at 61.4 is in neutral territory, which is significant for judging the sustainability of the current trend.
- Volatility/Drawdown: 30-day annualized volatility of 61.5% and maximum drawdown of -36.6% should be used as benchmarks for position sizing.
- Price Levels: A trend reversal is likely when the short-term support at 736000.00 or resistance at 949000.00 is broken or breached.
Desk Memo (Brief Comments)
Given the high volatility, simply reducing position size can significantly lower the fluctuation range of returns. Today is a day to prioritize stop-loss rules over coffee.
Key Chart
Financial Statements & Indicators
| Category | Value |
|---|---|
| Composite Score | 84.6/100 |
| Value/Technical/Risk | 87.5 / 81.1 / 84.0 |
| Current Price | 949000.00 |
| 1M/3M/6M Return | 27.7% / 66.5% / 252.8% |
| 30-Day Annualized Volatility | 61.5% |
| Max Drawdown (MDD) | -36.6% |
| 52-Week Range | 164800.00 ~ 949000.00 |
| 20/60/120-Day MA | 848050.00 / 694616.67 / 557900.00 |
| RSI(14) | 61.4 |
| Short-Term Support/Resistance | 736000.00 / 949000.00 |
| Revenue Growth Rate | 66.1% |
| Operating Profit Margin | 58.4% |
| ROE | 49.4% |
| D/E | 0.18 |
| PER / PBR | 5.2 / 2.0 |
| Dividend Yield | 0.3% |
Dividends (History & Sustainability)
For dividends, sustainability is more important than the yield itself, especially whether the policy is maintained even when the economy and performance fluctuate. SK Hynix's dividend sustainability is currently assessed as 'Good'.
| Year | DPS | Payout Ratio |
|---|---|---|
| 2022 | 1200.00 | 4.1% |
| 2023 | 1200.00 | 4.1% |
| 2024 | 900.00 | 4.1% |
| 2025 | 2429.00 | 4.1% |
Investment Guru Perspective Simulation
The following content is not a reproduction of actual investment strategies but a style simulation applying the core questions of each investment philosophy to current data.
| Perspective | Style Score (0-100) | Current Focus | Hypothetical Action Scenario |
|---|---|---|---|
| Warren Buffett (Quality & Margin of Safety) | 100.0 | ROE 49.4%, Operating Profit Margin 58.4%, D/E 0.18, PER 5.2 | Assuming business quality is maintained, consider phased buying and long-term holding. |
| Peter Lynch (Growth & Price Balance) | 100.0 | Revenue Growth Rate 66.1%, PEG Ratio ~0.08, 6-Month Return 252.8% | Track if the growth story translates into quarterly earnings and consider increasing position size. |
| George Soros (Trend & Speed of Reaction) | 100.0 | 1M/3M Return 27.7%/66.5%, Volatility 61.5%, RSI 61.4 | Given the fast-reacting price environment, strengthen short-term trading perspective upon catalyst emergence. |
Key Risks
Responding to bad scenarios is more important than good ones. For SK Hynix, changes in the current valuation metrics (PER 5.2, PBR 2.0) and 30-day annualized volatility (61.5%) can determine the speed of downside risk. This is akin to a safety net for maintaining a position.
- With annualized volatility at 61.5%, rapid fluctuations are possible before and after events, making adherence to stop-loss rules essential.
- The recent maximum drawdown of -36.6% is deep, posing a risk of breaking psychological lows if a downtrend resumes.
- Changes in consensus estimates and guidance comments before and after earnings announcements can dictate short-term direction.
- Valuation frameworks can change rapidly due to regulations, lawsuits, or policy shifts (trade/antitrust/financial regulations, etc.).
Counterarguments and Invalidation Conditions
The counterargument is that valuation pressure (PER 5.2, PBR 2.0) or a slowdown in demand could lead to multiple adjustments outpacing earnings improvement.
- If the price stays below the short-term support level of 736000.00 for more than two weeks, the current trend assumption will be invalidated.
- If the next quarter's revenue growth rate slows to below 63.1%, the growth assumption needs re-evaluation.
- If the consensus EPS is revised downwards for four consecutive weeks after the earnings release, the base scenario will be downgraded.
Checklist
Must-See Before Next Announcement/Earnings
- Confirm if the revenue growth rate is maintained at 64.1% or higher in the next quarterly earnings.
- Closely observe whether the stock price defends the short-term support level of 736000.00.
- Check if the consensus EPS estimates are being revised upwards for four consecutive weeks.
Portfolio Management Notes
Due to high volatility, concentrated investment in a single stock is not recommended. The current phase is more rationally approached by first establishing conditional entry criteria rather than betting on directionality.
Pre-Decision Check
- Have the direction of consensus EPS for the next two quarters (upward/downward) been confirmed?
- Can the financial structure (D/E, interest coverage, cash flow) withstand an economic slowdown?
- Does the entry price secure a risk-reward ratio of at least 1:2 compared to support/resistance levels?
- Are dividend policies (increase/maintain/decrease) and treasury stock policies consistently followed?
- Has the maximum acceptable loss been pre-defined in case of a pessimistic scenario?
Conclusion (Optimistic, Base, Pessimistic 3 Scenarios)
| Scenario | Assumption | Key Trigger | Target Price (Model) | Expected Return |
|---|---|---|---|---|
| Optimistic | Earnings surprise combined with multiple defense | Accelerating revenue growth + upward guidance revision | 1198025.19 | 26.2% |
| Base | Earnings meet consensus, multiples remain neutral | Margin defense + neutral supply/demand | 1069665.35 | 12.7% |
| Pessimistic | Earnings slowdown and multiple contraction occur simultaneously | Downward guidance + widening risk premium | 877125.59 | -7.6% |
The base case target price is 1069665.35. However, given the wide gap between the optimistic (26.2%) and pessimistic (-7.6%) scenarios, focusing on 'conditional response' rather than finding the 'right answer' is a more appropriate approach.
Data Sources
- Data As of:
2026-02-20 - Report Generated On:
2026-02-22 - Original Stock Link: https://finance.yahoo.com/quote/000660.KS
- Source Data: Yahoo Finance Price/Quote
Related Reports
Recent notes from the same market to compare assumptions.
- Naver (035420) KRW 254,500 | 3-Month +2.2% | Volatility 43.9% | Entry Timing Check Zone (As of: 2026-02-20) (As-of 2026-02-20)
- Grand Korea Leisure (114090) 13350.00 | 3M -6.1% | Vol 26.7% | Entry Timing Check Zone (As of: 2026-02-20) (As-of 2026-02-20)
- [The Market's Bare Face] Kakao Bank: Walking the Tightrope Between a Blocked Ceiling and a Solid Floor (As-of: 2026-02-19) (As-of 2026-02-19)
- Samsung Electronics (005930) ₩181,200 | 3-Month +86.4% | Annualized Volatility 55.1% | Entry Timing Check Zone (As of: 2026-02-13) (As-of 2026-02-13)