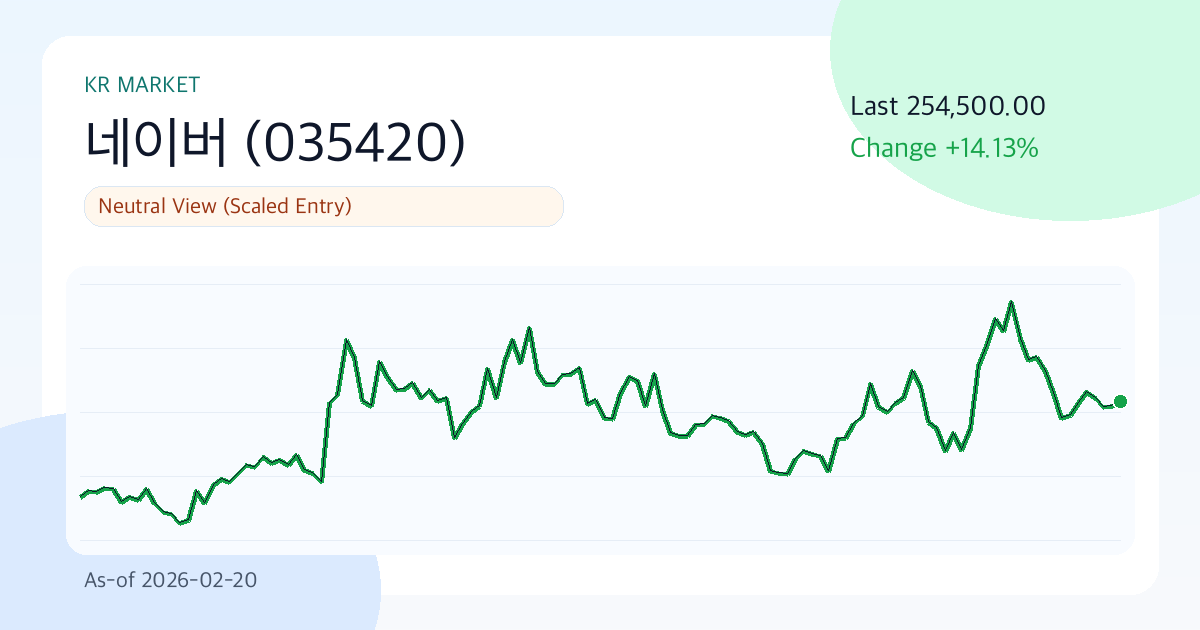
Naver (035420) KRW 254,500 | 3-Month +2.2% | Volatility 43.9% | Entry Timing Check Zone (As of: 2026-02-20)
Summary
- One-Line Judgment: Neutral Outlook (Phased Approach)
- Confidence Level: Moderate
- Comment: Naver is currently in the KRW 254,500 range with a 30-day annualized volatility of 43.9%. The 3-month return of 2.2% and whether the 20-day moving average (KRW 261,400) holds as support are key variables determining short-term direction. This is a time when wisdom lies in clearly defining 'what conditions would prompt a change in strategy' rather than making hasty bets.
Key Points (3 Lines)
- The key observation point for this phase is whether the price remains above the 20-day moving average (KRW 261,400). If it holds, short-term supply/demand dynamics are likely to be favorable.
- The combination of a 19.1% margin and 10.0% ROE signals that the core business's strength is not weak, but the D/E ratio of 0.16 requires checking interest rate sensitivity as well.
- Based on a dividend yield of 1.0% and an average payout ratio of 7.8%, dividend sustainability is rated as 'Good'.
Looking at Naver's chart today, the first thing you notice is rhythm rather than numbers. This current phase is neutral, and confidence tends to depend on data updates. Therefore, it's more advantageous to pre-determine 'under what conditions the judgment will change' rather than reaching hasty conclusions.
Investment Thesis (Value)
The core of this phase is whether growth and profitability are maintained simultaneously. If the quality of Naver's earnings remains stable, and the market's valuation (PER 16.3, PBR 2.0) for those earnings does not excessively decline, the current valuation will become more justifiable over time.
The core thesis is whether the combination of 'financial strength (19.1% margin, 10.0% ROE) and current price momentum (3-month 2.2%)' can lead to a re-rating in the next 1-2 quarters.
- Growth: A revenue growth rate of 10.7% indicates a phase of top-line expansion.
- Profitability: An operating profit margin of 19.1% and ROE of 10.0% are interpreted as within the normal range or at the lower end.
- Valuation: PER 16.3 and PBR 2.0 are classified as neutral to reasonable.
- Shareholder Returns: The combination of an average payout ratio of 7.8% and a dividend yield of 1.0% offers limited appeal for shareholder returns.
Unique Argument of This Report (Basis)
- The primary basis for the current judgment is the supply/demand directionality created by the recent 3-month return of 2.2% and the price's position relative to the 20-day moving average (KRW 261,400).
- Financial strength is assessed by the operating profit margin of 19.1% and ROE of 10.0%. If both of these values decline simultaneously, the investment thesis's quality will rapidly weaken.
- The valuation metrics are PER 16.3 and PBR 2.0. The core of this report is whether 'this valuation is excessive relative to the 10.7% growth rate'.
Technical Analysis
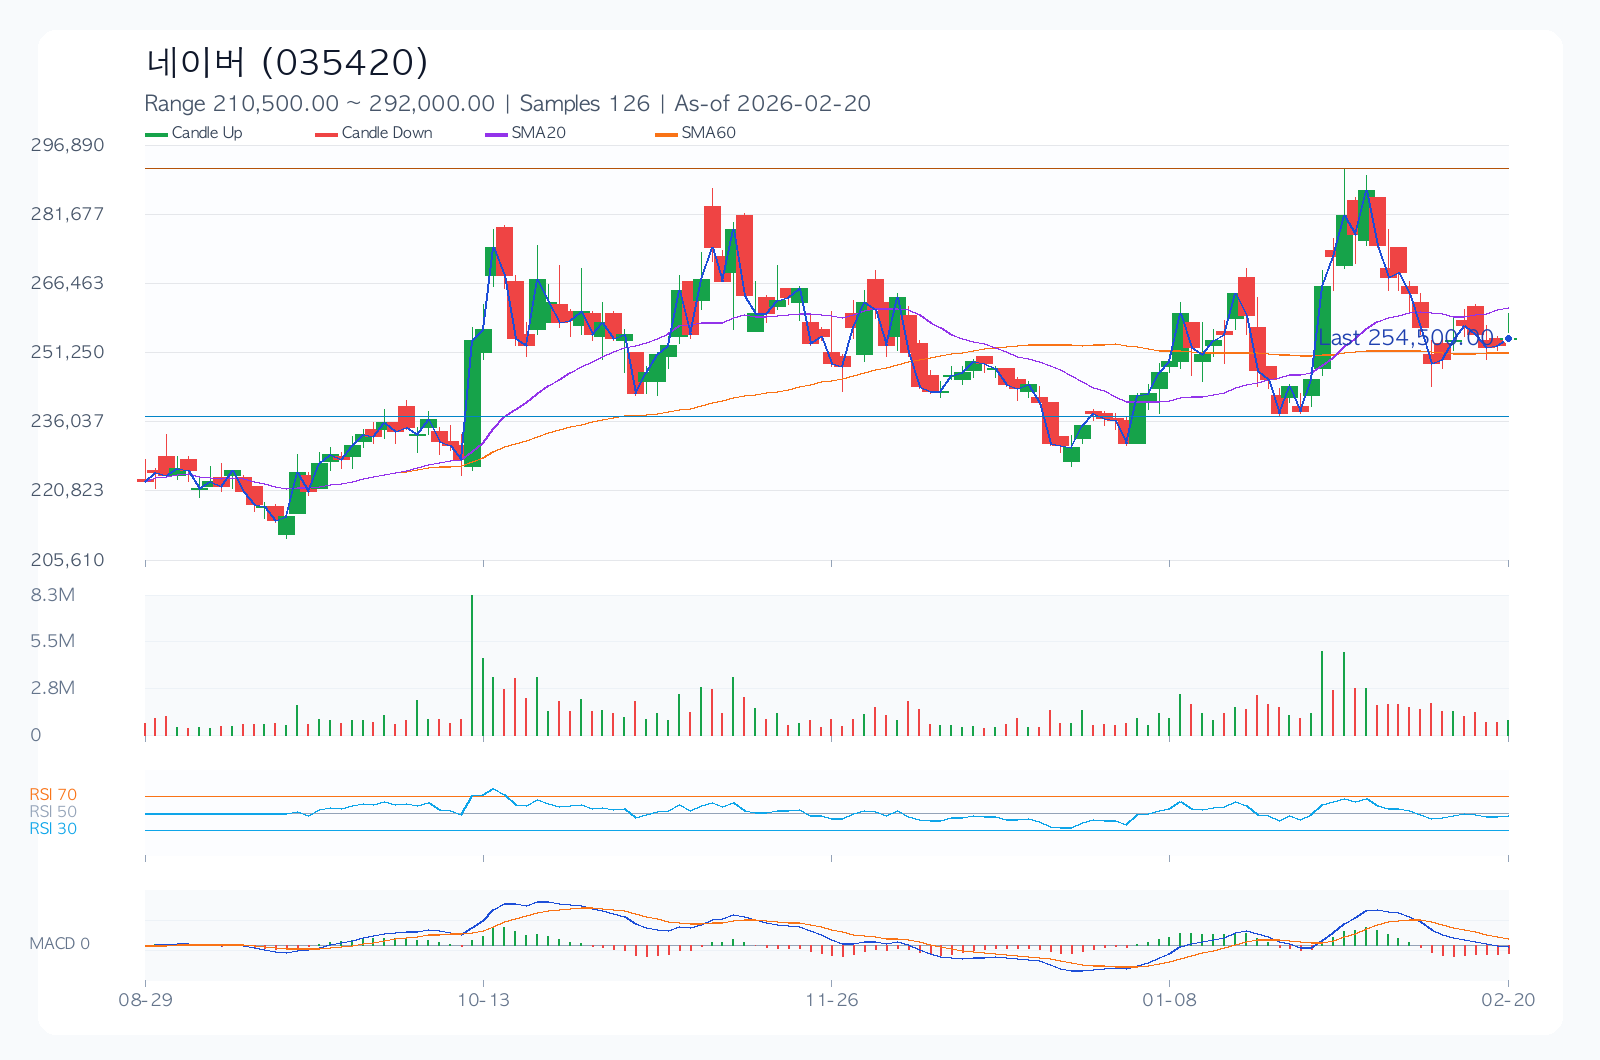
Technically, this is a juncture where conviction and doubt coexist. Therefore, level management (support at KRW 238,000 / resistance at KRW 287,000) is likely to account for most of the performance, rather than chasing the price.
- Trend: The 20-day/60-day/120-day moving averages are KRW 261,400 / KRW 251,450 / KRW 248,914.58, respectively, and are in a positive alignment.
- Momentum: With 1-month at 4.3%, 3-month at 2.2%, and 6-month at 14.1%, mid-term momentum is dominant.
- Overbought/Oversold: RSI(14) is at 32.3, indicating a neutral zone.
- Volatility/Drawdown: 30-day annualized volatility of 43.9% and a maximum drawdown of -26.2% should be used as benchmarks for position sizing.
- Price Levels: A trend reversal is likely when the short-term support at KRW 238,000 or resistance at KRW 287,000 is broken.
Desk Memo (Light Comment)
Today's market is one where stop-loss rules are needed before coffee. Given the high volatility, simply reducing position size can significantly lower return fluctuations.
Key Chart
Financial Statements & Indicators
| Category | Value |
|---|---|
| Overall Score | 64.1/100 |
| Value/Technical/Risk | 60.3 / 48.6 / 100.0 |
| Current Price | 254500.00 |
| 1M/3M/6M Return | 4.3% / 2.2% / 14.1% |
| 30-Day Annualized Volatility | 43.9% |
| Max Drawdown (MDD) | -26.2% |
| 52-Week Range | 176900.00 ~ 290500.00 |
| 20/60/120-Day MA | 261400.00 / 251450.00 / 248914.58 |
| RSI(14) | 32.3 |
| Short-Term Support/Resistance | 238000.00 / 287000.00 |
| Revenue Growth Rate | 10.7% |
| Operating Profit Margin | 19.1% |
| ROE | 10.0% |
| D/E | 0.16 |
| PER / PBR | 16.3 / 2.0 |
| Dividend Yield | 1.0% |
Dividends (History & Sustainability)
Dividends are more important for policy sustainability during economic and earnings fluctuations than for their yield itself. The current assessment is 'Good'.
| Year | DPS | Payout Ratio |
|---|---|---|
| 2022 | 914.00 | 7.8% |
| 2023 | 1205.00 | 7.8% |
| 2024 | 0.00 | 7.8% |
| 2025 | 1130.00 | 7.8% |
Investment Guru Perspective Simulation
The following content is not a reproduction of actual guru trades but a style simulation applying the core questions of each investment philosophy to current data.
| Perspective | Style Score (0-100) | Current Observation Point | Hypothetical Action Scenario |
|---|---|---|---|
| Warren Buffett (Quality & Margin of Safety) | 46.7 | ROE 10.0%, Operating Profit Margin 19.1%, D/E 0.16, PER 16.3 | Quality confirmed, but insufficient price margin of safety; holding off. |
| Peter Lynch (Growth & Price Balance) | 66.6 | Revenue Growth Rate 10.7%, PEG Ratio (approx.) 1.52, 6-Month Return 14.1% | Small tracking position until confirmation of sustained growth rate. |
| George Soros (Trend & Speed of Reaction) | 45.8 | 1M/3M Return 4.3%/2.2%, Volatility 43.9%, RSI 32.3 | Low trend reliability; observing until signals are confirmed, only reacting to reversal signs. |
Key Risks
More important than a good scenario is how to respond when a bad scenario occurs. For Naver, the current risk statement is not a warning but closer to a safety net for protecting the position. In the current phase, changes in valuation multiples (PER 16.3, PBR 2.0) and 30-day annualized volatility (43.9%) can significantly influence the speed of downside risk.
- With 43.9% annualized volatility, rapid fluctuations are possible before and after events, making stop-loss rules essential.
- Changes in consensus and guidance comments before and after earnings announcements can influence short-term direction.
- Valuation frameworks can change rapidly due to regulatory, litigation, or policy changes (trade, antitrust, financial regulations, etc.).
- Weakening market share and profit margin defense due to changes in competitive intensity in core businesses.
Counterarguments and Invalidation Conditions
The counterargument is that 'valuation burden (PER 16.3, PBR 2.0) or demand slowdown, if confirmed, could lead to multiple compression faster than earnings improvement.'
- If the price remains below the short-term support level of KRW 238,000 for more than two weeks, the current trend assumption will be considered invalid.
- If the next quarter's revenue growth rate slows to below 7.7%, the growth assumption needs re-evaluation.
- If consensus EPS is revised downwards for four consecutive weeks after the earnings announcement, the base scenario will be adjusted downwards.
Checklist
Must-See Before Next Disclosure/Earnings
- Confirm if revenue growth rate remains above 8.7% in the next quarterly earnings.
- Confirm if the stock price defends the short-term support level of KRW 238,000.
- Confirm if consensus EPS estimates are revised upwards for four consecutive weeks.
Portfolio Management Notes
Concentrating on a single stock is not recommended due to high volatility. As the outlook is neutral, a rational approach involves setting conditional entry criteria before betting on direction.
Pre-Decision Checks
- Have the direction of consensus EPS for the next two quarters (upward/downward) been confirmed?
- Can the financial structure (D/E, interest coverage, cash flow) withstand an economic slowdown?
- Does the entry price secure a risk-reward ratio of at least 1:2 relative to support/resistance levels?
- Are dividend policies (increase/maintain/reduce) and treasury stock policies consistently followed?
- Has the maximum acceptable loss limit in case of a pessimistic scenario been pre-defined?
Conclusion (Optimistic, Base, Pessimistic 3 Scenarios)
| Scenario | Assumption | Key Trigger | Target Price (Model) | Expected Return |
|---|---|---|---|---|
| Optimistic | Earnings surprise combined with multiple defense. | Accelerating revenue growth + upward guidance revision. | 293214.95 | 15.2% |
| Base | Earnings meet consensus, multiples remain neutral. | Margin defense + neutral supply/demand. | 261799.06 | 2.9% |
| Pessimistic | Earnings slowdown combined with multiple compression. | Downward guidance revision + expanded risk premium. | 214675.23 | -15.6% |
The target price for the base scenario is KRW 261,799.06. However, given the wide gap between the optimistic (15.2%) and pessimistic (-15.6%) scenarios, it is reasonable to view this stock as being in a phase where 'conditional response' is more important than finding the 'correct answer'.
Data Sources
- Data As of:
2026-02-20 - Report Generated On:
2026-02-22 - Original Stock Link: https://finance.yahoo.com/quote/035420.KS
- Source Data: Yahoo Finance Price/Quote
Related Reports
Recent notes from the same market to compare assumptions.
- Grand Korea Leisure (114090) 13350.00 | 3M -6.1% | Vol 26.7% | Entry Timing Check Zone (As of: 2026-02-20) (As-of 2026-02-20)
- SK Hynix (000660) 949000.00 | 3M +66.5% | Vol 61.5% | Momentum Check Phase (As of: 2026-02-20) (As-of 2026-02-20)
- [The Market's Bare Face] Kakao Bank: Walking the Tightrope Between a Blocked Ceiling and a Solid Floor (As-of: 2026-02-19) (As-of 2026-02-19)
- Samsung Electronics (005930) ₩181,200 | 3-Month +86.4% | Annualized Volatility 55.1% | Entry Timing Check Zone (As of: 2026-02-13) (As-of 2026-02-13)