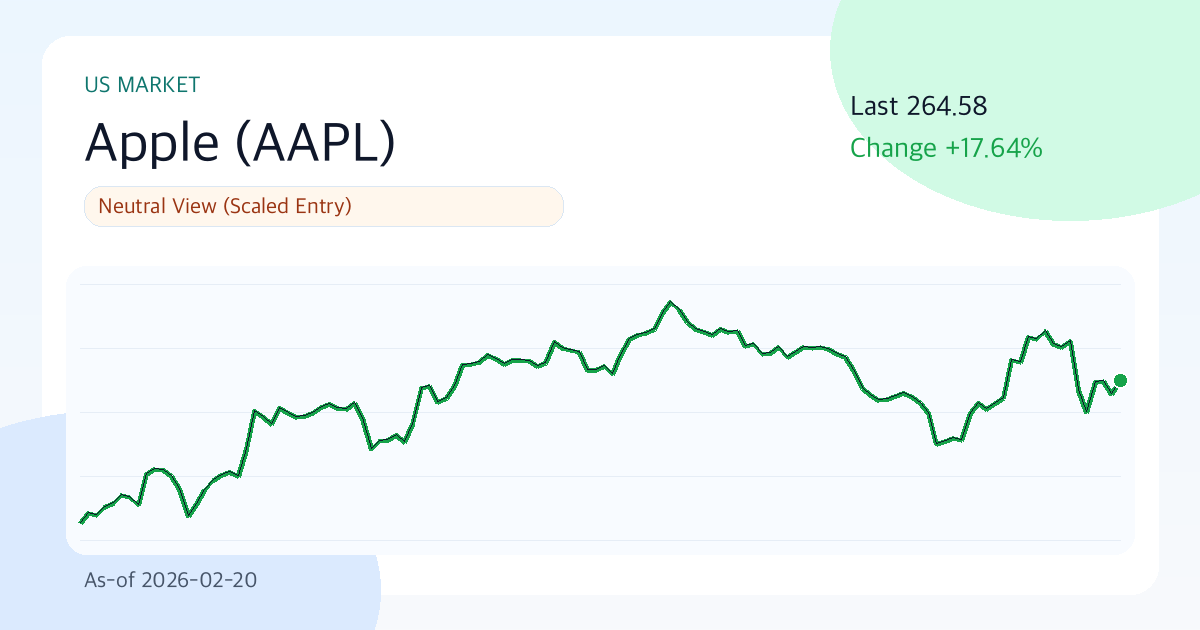
Apple (AAPL) 264.58 | 3-Month -1.5% | Volatility 28.4% | Entry Timing Requires Cautious Approach (As of: 2026-02-20)
Summary
- One-Line Judgment: Neutral Outlook (Phased Approach)
- Confidence Level: High
- Comment: Overall score 66.8, Valuation 71.5, Technicals 47.6, Risk 90.0. Currently at $264.58, with short-term support at $246.70 and resistance at $278.12. 30-day annualized volatility is 28.4%. It is more advantageous to clearly define 'under what conditions to change the response' rather than making hasty judgments.
Key Points (3 Lines)
- In the short term, whether the price stays above the 20-day moving average ($265.03) is a key indicator for assessing the possibility of improved supply and demand.
- While margins at 35.4% and ROE at 152.0% are positive, the D/E ratio of 1.03 requires consideration of its impact from interest rate fluctuations.
- Based on a dividend yield of 0.4% and an average payout ratio of 13.0%, dividend sustainability is at a 'Good' level.
Although Apple's chart currently faces strong headwinds, the possibility of a directional change is also open. It is wiser to first determine 'under what conditions to change the judgment' rather than reaching a hasty conclusion.
Investment Rationale (Valuation)
If growth and profitability are maintained simultaneously, Apple's earnings quality and the market's valuation (PER 33.5, PBR 44.1) will remain, and the current assessment will gain credibility over time.
The key is whether solid financial strength (operating margin 35.4%, ROE 152.0%) combined with current price momentum (3-month -1.5%) can lead to a re-rating in the next 1-2 quarters.
- Growth: A revenue growth rate of 15.7% suggests a phase of top-line expansion.
- Profitability: An operating margin of 35.4% and ROE of 152.0% indicate potential for top-tier performance within the industry.
- Valuation: PER 33.5 and PBR 44.1 are classified as areas with a burden of overvaluation at present.
- Capital Return: The combination of an average payout ratio of 13.0% and a dividend yield of 0.4% limits shareholder return attractiveness.
Unique Argument of This Report (Basis)
- The primary basis for the current judgment is the supply and demand directionality identified by the price's position above/below the 20-day moving average ($265.03) and the recent 3-month return of -1.5%.
- While an operating margin of 35.4% and ROE of 152.0% show sound core business strength, the D/E ratio of 1.03 necessitates considering interest rate sensitivity.
- The valuation of PER 33.5 and PBR 44.1 is part of the process of finding the answer to the report's core question: 'Is this excessive compared to the 15.7% growth rate?'
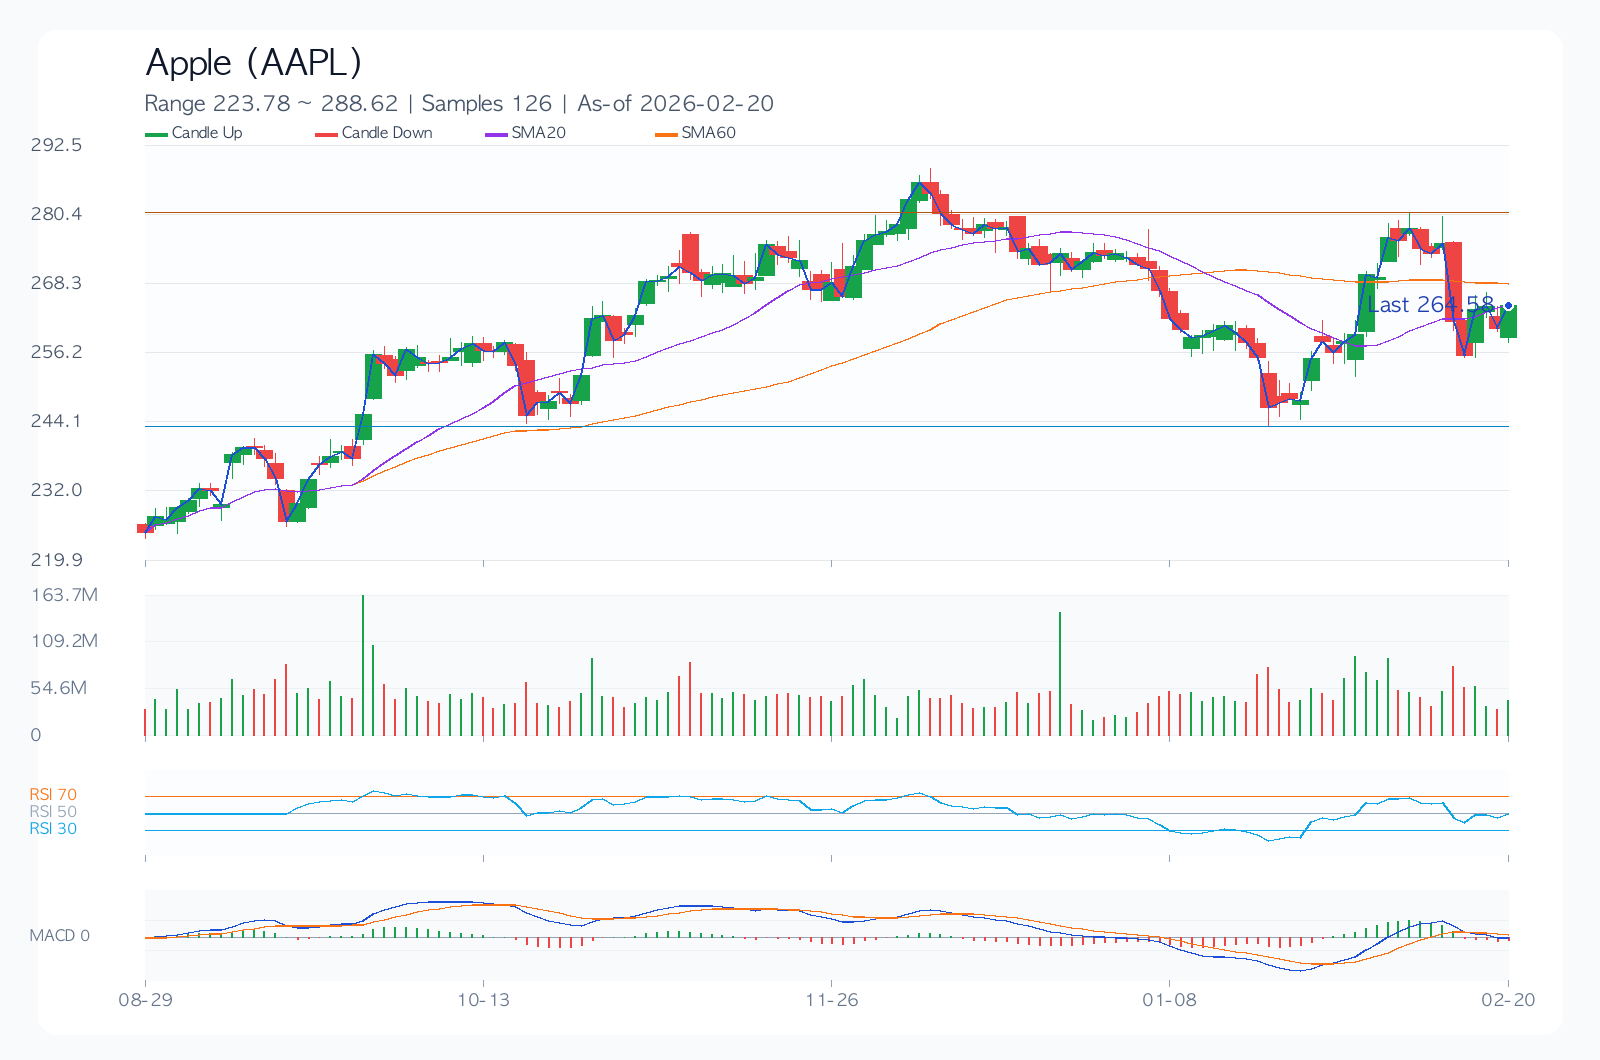
Technical Analysis
Technically, the current point is where conviction and doubt intersect. Level management (Support $246.70 / Resistance $278.12) is more likely to determine performance than chasing the rally.
- Trend: The 20-day/60-day/120-day moving averages ($265.03/$268.43/$261.86) show a mixed or inverse arrangement.
- Momentum: With 1-month at 6.5%, 3-month at -1.5%, and 6-month at 17.6%, directional uncertainty is high.
- Overbought/Oversold: The RSI(14) index is at 54.0, in neutral territory.
- Volatility/Drawdown: 30-day annualized volatility of 28.4% and maximum drawdown of -33.4% should be used as benchmarks for position sizing.
- Price Levels: A trend reversal is likely upon breaking through or falling below the short-term support at $246.70 and resistance at $278.12.
Desk Memo (Light Commentary)
While not a dramatic market, it is in these 'everyday' phases that adhering to principles builds long-term performance.
Key Chart
Financial Statements/Indicators
| Category | Value |
|---|---|
| Overall Score | 66.8/100 |
| Valuation/Technicals/Risk | 71.5 / 47.6 / 90.0 |
| Current Price | 264.58 |
| 1M/3M/6M Return | 6.5% / -1.5% / 17.6% |
| 30-Day Annualized Volatility | 28.4% |
| Max Drawdown (MDD) | -33.4% |
| 52-Week Range | 172.42 ~ 286.19 |
| 20/60/120-Day MA | 265.03 / 268.43 / 261.86 |
| RSI(14) | 54.0 |
| Short-Term Support/Resistance | 246.70 / 278.12 |
| Revenue Growth Rate | 15.7% |
| Operating Margin | 35.4% |
| ROE | 152.0% |
| D/E | 1.03 |
| PER / PBR | 33.5 / 44.1 |
| Dividend Yield | 0.4% |
Dividends (History/Sustainability)
Dividend sustainability is rated 'Good'. It is particularly important to see if the policy is maintained during economic and earnings fluctuations.
| Year | DPS | Payout Ratio |
|---|---|---|
| 2022 | 0.91 | 13.0% |
| 2023 | 0.95 | 13.0% |
| 2024 | 0.99 | 13.0% |
| 2025 | 1.03 | 13.0% |
Investment Guru Perspective Simulation
The following content is not a reproduction of actual trades by investment gurus, but a style simulation applying the core questions of each investment philosophy to current data.
| Perspective | Style Score (0-100) | Current Focus | Hypothetical Action Scenario |
|---|---|---|---|
| Warren Buffett Perspective (Quality/Margin of Safety) | 100.0 | ROE 152.0%, Operating Margin 35.4%, D/E 1.03, PER 33.5 | Assuming business quality is maintained, consider phased buying and long-term holding. |
| Peter Lynch Perspective (Growth/Price Balance) | 62.2 | Revenue Growth Rate 15.7%, PEG Ratio approx. 2.13, 6-Month Return 17.6% | Small tracking position until the sustainability of growth is confirmed. |
| George Soros Perspective (Trend/Reaction Speed) | 51.3 | 1M/3M Return 6.5%/-1.5%, Volatility 28.4%, RSI 54.0 | Event-driven response over direction, set stop-loss criteria first. |
Key Risks
As a safety measure to protect positions, one must be wary that changes in current valuation (PER 33.5, PBR 44.1) and 30-day annualized volatility (28.4%) can influence the speed of downside risk.
- A PER of 33.5 indicates an overvalued state, and earnings misses could increase pressure for multiple contraction.
- The maximum drawdown (-33.4%) based on recent time series is deep, posing a risk of breaking psychological lows if a downtrend resumes.
- Changes in consensus estimates and management's guidance comments before and after earnings announcements can influence short-term direction.
- Regulatory, legal, or policy changes (trade, antitrust, financial regulations, etc.) are potential factors that could drastically alter the valuation framework.
Counterarguments and Invalidating Conditions
However, if valuation pressure (PER 33.5, PBR 44.1) or signs of demand slowdown become apparent, the speed of multiple adjustments could outpace earnings improvements, serving as a counterargument.
- If the stock remains below the short-term support level of $246.70 for more than two weeks, the current trend assumption will be considered invalid.
- If the next quarter's revenue growth rate slows to below 12.7%, the growth assumption needs to be re-evaluated.
- If consensus EPS is revised downward for four consecutive weeks after an earnings announcement, the base scenario will be lowered.
Checklist
Must-See Before Next Announcement/Earnings
- Confirm that the next quarter's revenue growth rate remains above 13.7%.
- Pay attention to whether the stock price successfully defends the short-term support level of $246.70.
- Check if consensus EPS estimates are revised upward for four consecutive weeks.
Portfolio Management Notes
While volatility itself is not overheated, it can increase around events. A rational approach involves setting conditional entry criteria before betting on direction.
Pre-Decision Checks
- Have the direction of consensus EPS for the next two quarters (upward/downward) been confirmed?
- Can the financial structure (D/E, interest coverage, cash flow) maintain stability even in an economic slowdown?
- Does the current entry price secure a risk-reward ratio of at least 1:2 compared to support/resistance levels?
- Are dividend policy (increase/maintain/decrease) and share buyback policies consistently followed?
- In the event of a pessimistic scenario, has the maximum acceptable loss limit been defined in advance?
Conclusion (Optimistic, Base, Pessimistic 3 Scenarios)
| Scenario | Assumption | Key Trigger | Target Price (Model) | Expected Return |
|---|---|---|---|---|
| Optimistic | Earnings surprise and simultaneous multiple expansion occur | Acceleration of revenue growth rate and upward revision of guidance | 308.44 | 16.6% |
| Base | Earnings meet consensus levels, and multiples remain at current levels | Margin defense and stabilization of supply/demand | 275.39 | 4.1% |
| Pessimistic | Earnings slowdown and simultaneous multiple contraction occur | Downward revision of guidance and expansion of risk premium | 225.82 | -14.6% |
The base scenario target price is $275.39. However, the gap between the optimistic (16.6%) and pessimistic (-14.6%) scenarios is wide, indicating that 'conditional response' is more important than finding the 'right answer' at this stage.
Data Sources
- Data As Of:
2026-02-20 - Report Generated On:
2026-02-22 - Original Stock Link: https://finance.yahoo.com/quote/AAPL
- Source Data: Yahoo Finance Price/Quote
Related Reports
Recent notes from the same market to compare assumptions.
- JPMorgan Chase(JPM) 289.48 | 3M -8.4% | Vol 26.8% | Risk Management Priority Zone (As of: 2026-03-06) (As-of 2026-03-06)
- Broadcom(AVGO) 330.48 | 3M -13.3% | Vol 37.5% | Entry Timing Check Zone (As of: 2026-03-06) (As-of 2026-03-06)
- Meta Platforms(META) 644.86 | 3M -2.5% | Vol 40.0% | Entry Timing Check Zone (As of: 2026-03-06) (As-of 2026-03-06)
- Exxon Mobil(XOM) 151.21 | 3M +29.1% | Vol 28.3% | Entry Timing Check Zone (As of: 2026-03-06) (As-of 2026-03-06)