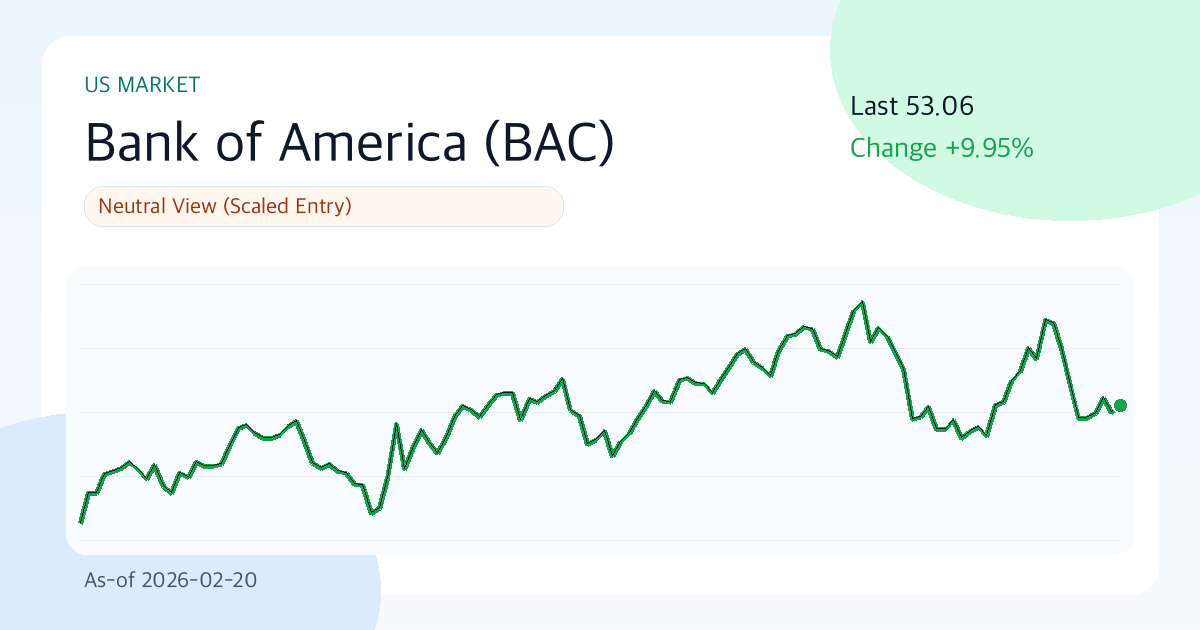
Bank of America (BAC) 53.06 | 3M +2.0% | Vol 23.5% | Conditional Access Zone (As of: 2026-02-20)
Summary
- One-Line Judgment: Neutral View (Phased Access)
- Confidence Level: High
- Comment: Bank of America (BAC) is currently trading at $53.06, with a 3-month return of 2.0%. Given the 30-day annualized volatility of 23.5%, it is crucial at this juncture to clarify 'under what conditions the response will change' rather than forming strong buy/sell convictions.
Key Points (3 Lines)
- The first point to watch for short-term supply and demand trends is whether the price remains above the 20-day moving average ($53.60).
- While a 35.6% margin and 10.2% ROE are solid, the D/E ratio of 2.71 requires consideration of interest rate sensitivity.
- Based on a dividend yield of 2.1% and an average payout ratio of 28.4%, dividend sustainability is rated 'Caution'.
Bank of America's current position calls for focusing on 'certain variables' rather than making hasty bets. It is a time to clearly define the conditions under which investment decisions will be reversed, rather than rushing to conclusions.
Investment Thesis (Value)
As the revenue growth rate of 13.2% is maintained, if qualitative growth is supported, the current valuation (PER 13.9, PBR 1.4) will gain rational explanatory power over time. In other words, the 'quality of earnings' is key.
The core question is this: Can the financial soundness represented by a 35.6% operating margin and 10.2% ROE sustain momentum exceeding the recent 3-month return of 2.0% for another 1-2 quarters? This is the central axis of this report.
- Growth: A revenue growth rate of 13.2% indicates top-line expansion.
- Profitability: An operating margin of 35.6% and ROE of 10.2% are interpreted as normal or at the lower end of the range.
- Valuation: PER of 13.9 and PBR of 1.4 are classified as neutral to reasonable within the range.
- Capital Return: The combination of a 28.4% payout ratio and a 2.1% dividend yield adds to shareholder return appeal.
Unique Argument of This Article (Basis)
- The primary criterion for judgment at this point is the price's position above/below the 20-day moving average ($53.60) and the surrounding supply and demand dynamics.
- An operating margin of 35.6% and ROE of 10.2% demonstrate the core business's strength, but the foundation of the investment thesis will be shaken the moment these figures decline.
- Whether the valuation of PER 13.9 and PBR 1.4 is excessive relative to the 13.2% revenue growth rate is the core of this report.
Technical Analysis
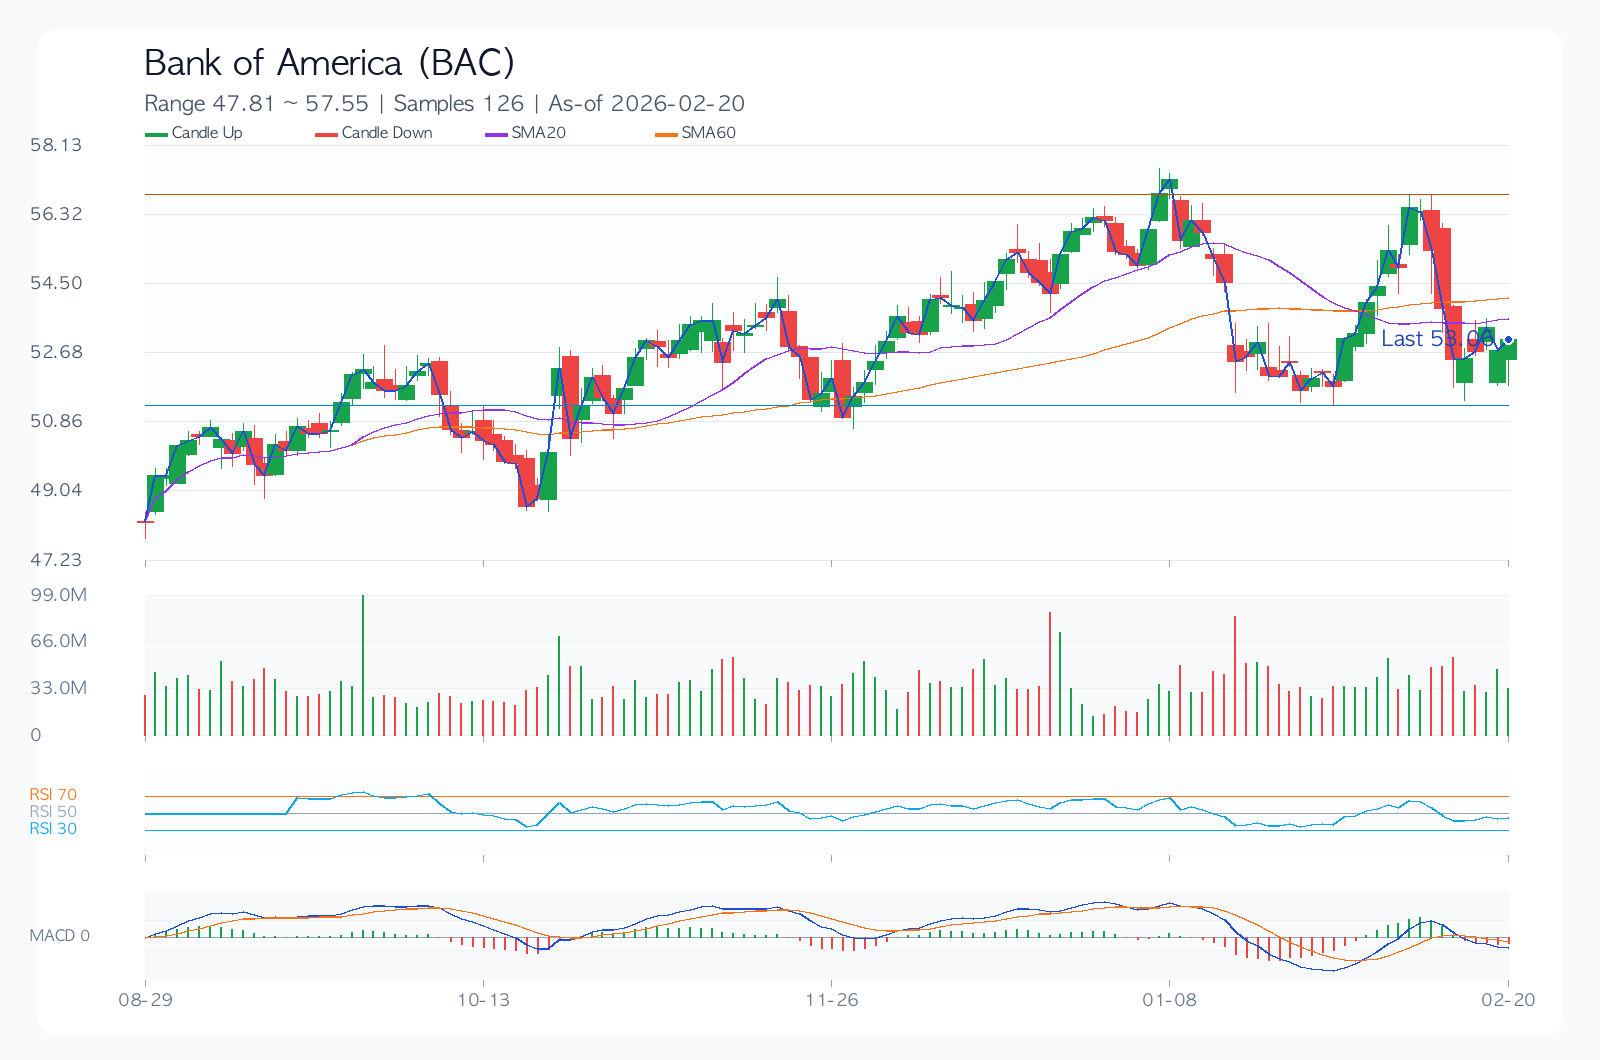
From a technical perspective, this is a point where conviction and doubt intersect. The management of levels between the support at $51.72 and resistance at $56.53 is likely to determine performance. A cautious approach is necessary rather than chasing the rally.
- Trend: The 20/60/120-day moving averages ($53.60/$54.15/$52.84) are mixed or in a bearish arrangement.
- Momentum: With 1-month at 1.2%, 3-month at 2.0%, and 6-month at 9.9%, mid-term momentum is dominant.
- Overbought/Oversold: RSI(14) is at 49.3, indicating a neutral zone.
- Volatility/Drawdown: 30-day annualized volatility of 23.5% and a maximum drawdown of -28.0% can serve as a basis for position sizing.
- Price Levels: A trend reversal is possible upon breaking through or falling below the short-term support at $51.72 and resistance at $56.53.
Desk Memo (Light Comment)
In periods when the overall market is not volatile, adhering to small principles creates long-term performance.
Key Chart
Financial Statements & Indicators
| Category | Value |
|---|---|
| Overall Score | 58.2/100 |
| Value/Technical/Risk | 55.9 / 44.7 / 87.0 |
| Current Price | 53.06 |
| 1M/3M/6M Return | 1.2% / 2.0% / 9.9% |
| 30-Day Annualized Volatility | 23.5% |
| Max Drawdown (MDD) | -28.0% |
| 52-Week Range | 34.39 ~ 57.25 |
| 20/60/120-Day MA | 53.60 / 54.15 / 52.84 |
| RSI(14) | 49.3 |
| Short-Term Support/Resistance | 51.72 / 56.53 |
| Revenue Growth Rate | 13.2% |
| Operating Margin | 35.6% |
| ROE | 10.2% |
| D/E | 2.71 |
| PER / PBR | 13.9 / 1.4 |
| Dividend Yield | 2.1% |
Dividends (History & Sustainability)
While the dividend yield of 2.07% itself is important, the key is whether the policy can be maintained when earnings and interest rates fluctuate. The current 'Caution' rating reflects this uncertainty.
| Year | DPS | Payout Ratio |
|---|---|---|
| 2022 | 0.86 | 28.4% |
| 2023 | 0.92 | 28.4% |
| 2024 | 1.00 | 28.4% |
| 2025 | 1.08 | 28.4% |
Investment Guru Perspective Simulation
The following simulation is a mock analysis applying data to key investment questions, not a reproduction of actual investor trades.
| Perspective | Style Score (0-100) | Current Focus | Hypothetical Action Scenario |
|---|---|---|---|
| Warren Buffett (Quality/Margin of Safety) | 24.1 | ROE 10.2%, Operating Margin 35.6%, D/E 2.71, PER 13.9 | Confirms quality but deems margin of safety insufficient; holds off. |
| Peter Lynch (Growth/Price Balance) | 68.5 | Revenue Growth 13.2%, PEG Ratio ~1.06, 6-Month Return 9.9% | Considers increasing position while tracking if growth story translates into quarterly earnings. |
| George Soros (Trend/Reaction Speed) | 49.8 | 1M/3M Return 1.2%/2.0%, Volatility 23.5%, RSI 49.3 | Observes due to low trend reliability; acts only upon signs of reversal. |
Key Risks
Preparation for bad scenarios is more important than for good ones. For BAC, changes in valuation (PER 13.9, PBR 1.4) and 30-day annualized volatility (23.5%) can determine the speed of downside risk. This should be used as a safety mechanism to protect the position.
- A high D/E ratio (2.71) can expose vulnerabilities during rising interest rates or increased refinancing costs.
- Changes in consensus estimates and guidance comments before and after earnings announcements can determine short-term direction.
- Regulations, lawsuits, and policy changes can rapidly alter the valuation framework.
- Intensifying competition in core businesses can weaken market share and margin defense capabilities.
Counterarguments and Invalidating Conditions
The issue arises when valuation pressure (PER 13.9, PBR 1.4) is priced in before a slowdown in demand. In this case, stock multiple adjustments may be steeper than the improvement in corporate earnings.
- If the price remains below the support level of $51.72 for more than two weeks, the current trend assumption will no longer be valid.
- If the next quarter's revenue growth slows to below 10.2%, the growth thesis needs re-evaluation.
- If consensus EPS is revised downward for four consecutive weeks after an earnings announcement, the base scenario should be lowered.
Checklist
Must-See Before Next Disclosure/Earnings
- Confirm that the next quarter's revenue growth rate is maintained at 11.2% or higher.
- Closely monitor whether the stock price defends the short-term support level of $51.72.
- Observe whether consensus EPS estimates are revised upward for four consecutive weeks.
Portfolio Management Notes
While not currently overheated in terms of volatility, movements around events can still be significant. It is more rational to set clear entry conditions rather than betting on direction.
Pre-Decision Checks
- Have the future 2-quarter EPS consensus trend (upward/downward) been confirmed?
- Can the financial structure (D/E, interest coverage, cash flow) withstand a recessionary environment?
- Does the entry price secure a risk-reward ratio of at least 1:2 relative to support/resistance?
- Are dividend policies (increase/maintain/decrease) and share buyback policies consistently maintained?
- In the event of a pessimistic scenario, has the maximum acceptable loss limit been pre-defined?
Conclusion (Optimistic, Base, Pessimistic 3 Scenarios)
| Scenario | Assumption | Key Trigger | Target Price (Model) | Expected Return |
|---|---|---|---|---|
| Optimistic | Scenario where earnings surprise and valuation multiple defense occur simultaneously. | Accelerating revenue growth and upward guidance revision | 58.45 | 10.2% |
| Base | Scenario where earnings meet consensus and valuation multiples remain at current levels. | Margin defense and neutral supply/demand maintenance | 52.19 | -1.6% |
| Pessimistic | Scenario where earnings slowdown and valuation multiple contraction occur simultaneously. | Downward guidance revision and widening risk premium | 42.80 | -19.3% |
The base scenario target price is $52.19. However, the gap between the optimistic (10.2%) and pessimistic (-19.3%) scenarios is substantial. This stock is in a phase where focusing on 'conditional response' is more appropriate than finding the 'correct answer'.
Data Sources
- Data As Of:
2026-02-20 - Report Generated On:
2026-02-21 - Original Stock Link: https://finance.yahoo.com/quote/BAC
- Source Data: Yahoo Finance Price/Quote
Related Reports
Recent notes from the same market to compare assumptions.
- JPMorgan Chase(JPM) 289.48 | 3M -8.4% | Vol 26.8% | Risk Management Priority Zone (As of: 2026-03-06) (As-of 2026-03-06)
- Broadcom(AVGO) 330.48 | 3M -13.3% | Vol 37.5% | Entry Timing Check Zone (As of: 2026-03-06) (As-of 2026-03-06)
- Meta Platforms(META) 644.86 | 3M -2.5% | Vol 40.0% | Entry Timing Check Zone (As of: 2026-03-06) (As-of 2026-03-06)
- Exxon Mobil(XOM) 151.21 | 3M +29.1% | Vol 28.3% | Entry Timing Check Zone (As of: 2026-03-06) (As-of 2026-03-06)