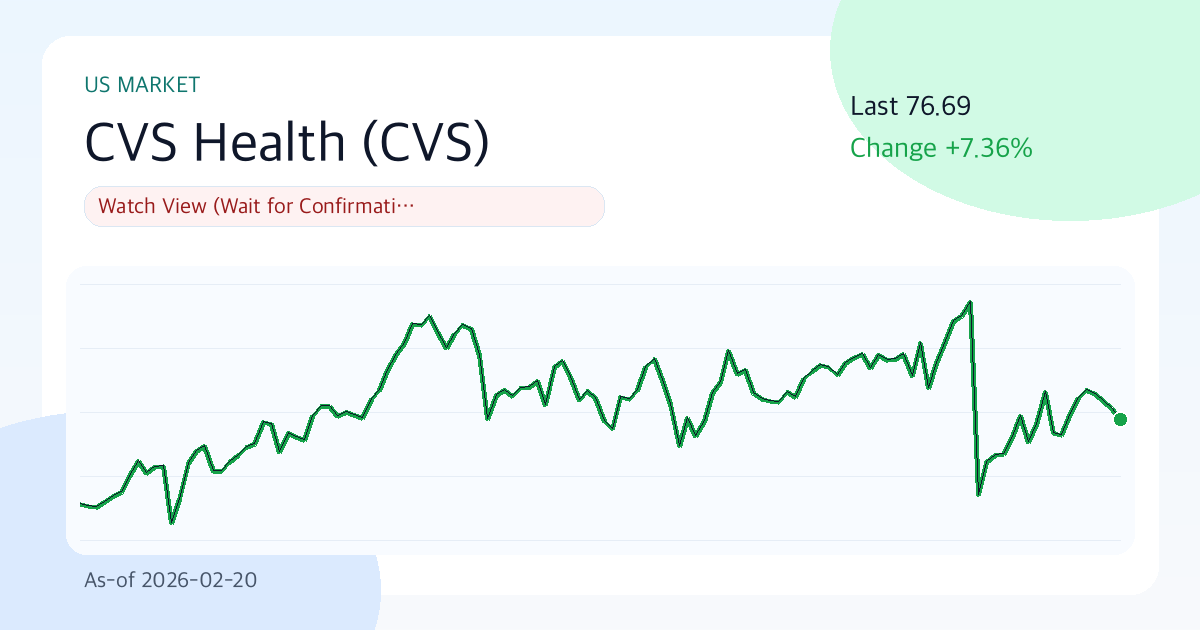
CVS Health (CVS) 76.69 | 3M +0.2% | Vol 48.2% | Risk Management Priority Zone (As of: 2026-02-20)
Summary
- One-line judgment: Wait-and-see approach (Respond after confirmation)
- Confidence level: Moderate
- Comment: CVS Health currently has a composite score of 48.6/100, with mixed indicators in Value (44.5), Technicals (42.9), and Risk (68.0). The current price is $76.69, with a short-term support level at $72.00, a resistance level at $83.87, and a 30-day annualized volatility of 48.2%. In this phase, it is more advantageous to define 'under what conditions to change the response' rather than relying solely on market predictions.
Key Points (3 Lines)
- The key point to watch in this phase is whether the price can be maintained above the 20-day moving average ($76.94). If this level holds as support, short-term supply/demand dynamics are likely to be favorable.
- A margin of 1.6% and ROE of 2.3% signal that the core business is not weak, but the D/E ratio of 1.06 requires consideration of interest rate sensitivity.
- Based on a dividend yield of 3.5% and an average payout ratio of 1.9%, dividend sustainability is assessed as 'Moderate'.
CVS Health's current price trend is in a neutral zone. It is wise to consider changes in judgment based on data updates rather than relying on strong conviction.
Investment Thesis (Value)
In a phase with valuation pressure, the stock price can be sensitive to even small changes in earnings. If the quality of CVS Health's earnings is maintained and the market multiples (PER 55.2, PBR 1.3) do not decline excessively, the current price level has the potential to be justified over time.
The core question is whether the combination of 'financial strength (operating margin 1.6%, ROE 2.3%) and current price momentum (3-month 0.2%) can lead to a stock price re-evaluation in the next 1-2 quarters.' Is this valuation reasonable compared to the growth rate (8.4%)? is the central point of this discussion.
- Growth: A revenue growth rate of 8.4% indicates top-line expansion.
- Profitability: An operating margin of 1.6% and ROE of 2.3% are interpreted as within the normal range or at the lower end.
- Valuation: PER of 55.2 and PBR of 1.3 are classified as having overvaluation pressure.
- Capital Return: The combination of an average payout ratio of 1.9% and a dividend yield of 3.5% is positive for shareholder return attractiveness.
Unique Argument of This Report (Basis)
- The primary basis for the current judgment is the 3-month return of 0.2% and the position relative to the 20-day moving average ($76.94). These will determine the direction of supply and demand.
- Core business strength is assessed by operating margin (1.6%) and ROE (2.3%); if these indicators decline simultaneously, the investment thesis will be significantly weakened.
- Is this valuation (PER 55.2, PBR 1.3) excessive compared to the growth rate of 8.4%? is the key point of this report.
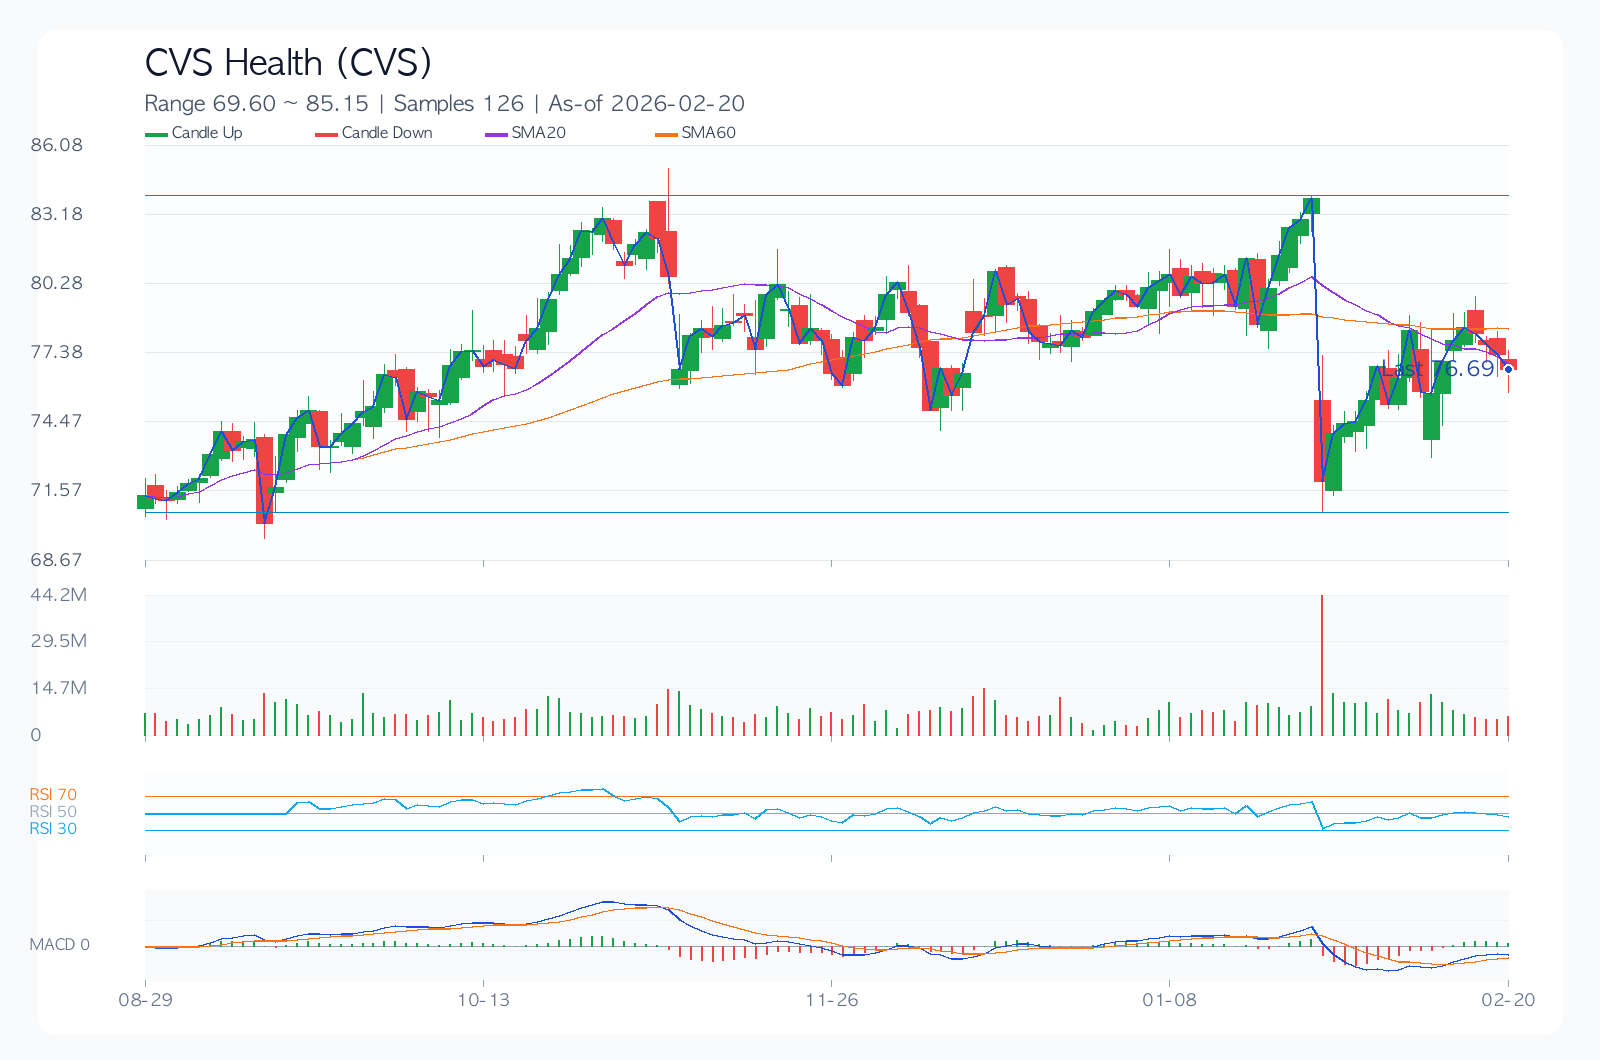
Technical Analysis
Technically, this is a point where conviction and doubt intersect. Therefore, focusing on level management (Support $72.00 / Resistance $83.87) rather than aggressive chasing will be beneficial for managing returns.
- Trend: The 20-day/60-day/120-day moving averages ($76.94/$78.43/$77.87) are mixed or in a bearish arrangement.
- Momentum: 1-month -7.2%, 3-month 0.2%, 6-month 7.4%, indicating mid-term momentum is dominant.
- Overbought/Oversold: RSI(14) is 57.6, in the neutral zone.
- Volatility/Drawdown: 30-day annualized volatility of 48.2% and maximum drawdown of -45.1% should be used as benchmarks for position sizing.
- Price Levels: A trend reversal is likely when the short-term support level of $72.00 or resistance level of $83.87 is broken.
Desk Memo (Casual Comment)
This is a volatile market. Simply adjusting position size can significantly reduce return volatility.
Key Chart
Financial Statements & Indicators
| Category | Value |
|---|---|
| Composite Score | 48.6/100 |
| Value/Technicals/Risk | 44.5 / 42.9 / 68.0 |
| Current Price | 76.69 |
| 1M/3M/6M Return | -7.2% / 0.2% / 7.4% |
| 30-Day Annualized Volatility | 48.2% |
| Max Drawdown (MDD) | -45.1% |
| 52-Week Range | 58.75 ~ 83.87 |
| 20/60/120-Day MA | 76.94 / 78.43 / 77.87 |
| RSI(14) | 57.6 |
| Short-Term Support/Resistance | 72.00 / 83.87 |
| Revenue Growth Rate | 8.4% |
| Operating Margin | 1.6% |
| ROE | 2.3% |
| D/E | 1.06 |
| PER / PBR | 55.2 / 1.3 |
| Dividend Yield | 3.5% |
Dividends (History & Sustainability)
Dividend sustainability is more important than the yield itself; it's about whether the policy can be maintained even in periods of economic and earnings fluctuations. Currently assessed as 'Moderate'.
| Year | DPS | Payout Ratio |
|---|---|---|
| 2022 | 2.20 | 1.9% |
| 2023 | 2.42 | 1.9% |
| 2024 | 2.66 | 1.9% |
| 2025 | 2.66 | 1.9% |
Investment Guru Perspective Simulation
The following scenarios are style simulations that apply questions from each investment philosophy to current data, not actual investment simulations.
| Perspective | Style Score (0-100) | Current Observation | Hypothetical Action Scenario |
|---|---|---|---|
| Warren Buffett (Quality/Margin of Safety) | 0.0 | ROE 2.3%, Operating Margin 1.6%, D/E 1.06, PER 55.2 | Quality is noted, but insufficient margin of safety in price; hold. |
| Peter Lynch (Growth/Price Balance) | 0.0 | Revenue Growth 8.4%, PEG Ratio ~6.57, 6-Month Return 7.4% | Story exists, but growth appeal relative to price is weak. |
| George Soros (Trend/Speed of Reaction) | 32.2 | 1M/3M Returns -7.2%/0.2%, Volatility 48.2%, RSI 57.6 | Low trend conviction; wait for signals before acting, only respond to signs of reversal. |
Key Risks
Risk management involves preparing for the worst-case scenario. For CVS Health, the current valuation (PER 55.2, PBR 1.3) and high volatility (30-day annualized 48.2%) are key variables determining the speed of downside risk.
- A PER of 55.2 is in a re-rating zone for overvaluation; if earnings miss, there will be pressure to compress multiples.
- With annualized volatility at 48.2%, there is a high possibility of sharp fluctuations before and after events, making adherence to stop-loss rules essential.
- Low operating margins make it difficult to defend profits in the event of rising costs or price competition.
- The recent maximum drawdown of -45.1% indicates a risk of breaking psychological lows if a downtrend resumes.
- Changes in consensus estimates and guidance comments around earnings releases can dictate short-term direction.
- Regulatory, litigation, and policy changes (trade, antitrust, financial regulations, etc.) can drastically alter the valuation framework.
Counterarguments and Invalidation Conditions
However, one must be wary that if valuation pressure (PER 55.2, PBR 1.3) is high or demand slowdown is detected, the speed of multiple adjustment may outpace the speed of earnings improvement.
- If the price remains below the short-term support level of $72.00 for more than two weeks, the current trend assumption will be invalidated.
- If the next quarter's revenue growth slows to below 5.4%, the growth thesis needs re-evaluation.
- If consensus EPS is revised downwards for four consecutive weeks after the earnings release, the base scenario will inevitably be lowered.
Checklist
Must-See Before Next Disclosure/Earnings
- Confirm if the next quarter's revenue growth rate can be maintained above 6.4%.
- Pay attention to whether the stock price successfully defends the short-term support level of $72.00.
- It is important to check if consensus EPS estimates are being revised upwards for four consecutive weeks.
Portfolio Management Notes
Considering the high volatility, concentrated investment in a single stock is not recommended. Establishing clear conditional entry criteria is more rational than betting on direction.
Pre-Decision Checks
- Have the direction (upward/downward revision) of consensus EPS for the next two quarters been confirmed?
- Can the financial structure (D/E, interest coverage, cash flow) withstand an economic slowdown?
- Does the entry price offer a risk-reward ratio of at least 1:2 relative to support/resistance levels?
- Are dividend policy (increase/maintain/decrease) and share buyback policies consistently followed?
- Has the maximum acceptable loss in the event of a downside scenario been defined in advance?
Conclusion (Optimistic, Base, Pessimistic 3 Scenarios)
| Scenario | Assumption | Key Trigger | Target Price (Model) | Expected Return |
|---|---|---|---|---|
| Optimistic | Simultaneous earnings surprise and multiple defense | Accelerating revenue growth + upward guidance revision | 78.07 | 1.8% |
| Base | Earnings meet consensus, multiples remain neutral | Margin defense + neutral supply/demand | 69.70 | -9.1% |
| Pessimistic | Simultaneous earnings slowdown and multiple contraction | Downward guidance revision + widening risk premium | 57.16 | -25.5% |
The target price for the base scenario is $69.70. However, given the wide gap between the optimistic (1.8%) and pessimistic (-25.5%) scenarios, it is reasonable to focus on 'conditional response' rather than finding the 'correct answer' for this stock.
Data Sources
- Data as of:
2026-02-20 - Report Generation Date:
2026-02-21 - Original Stock Link: https://finance.yahoo.com/quote/CVS
- Source Data: Yahoo Finance Price/Quote
Related Reports
Recent notes from the same market to compare assumptions.
- JPMorgan Chase(JPM) 289.48 | 3M -8.4% | Vol 26.8% | Risk Management Priority Zone (As of: 2026-03-06) (As-of 2026-03-06)
- Broadcom(AVGO) 330.48 | 3M -13.3% | Vol 37.5% | Entry Timing Check Zone (As of: 2026-03-06) (As-of 2026-03-06)
- Meta Platforms(META) 644.86 | 3M -2.5% | Vol 40.0% | Entry Timing Check Zone (As of: 2026-03-06) (As-of 2026-03-06)
- Exxon Mobil(XOM) 151.21 | 3M +29.1% | Vol 28.3% | Entry Timing Check Zone (As of: 2026-03-06) (As-of 2026-03-06)