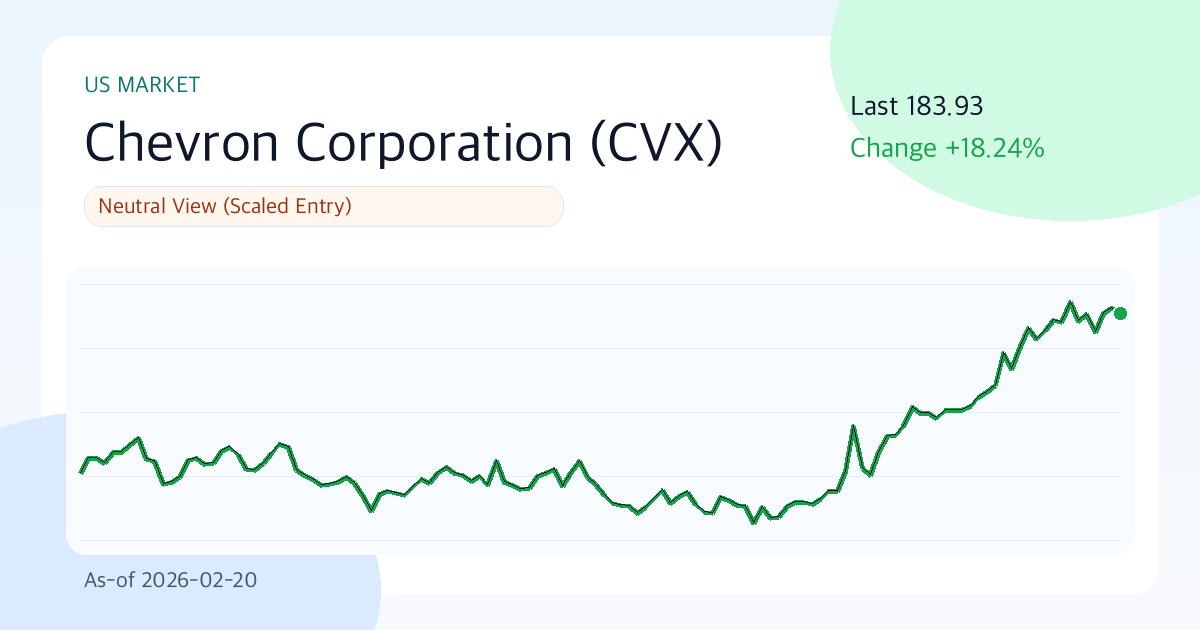
Chevron Corporation(CVX) 183.93 | 3M +21.2% | Vol 20.2% | Coexistence of Value and Momentum (As of: 2026-02-20)
Summary
- One-line Judgment: Neutral View (Phased Approach)
- Conviction Level: High
- Comment: Chevron (CVX) is currently trading at $183.93, showing solid momentum with a 21.2% rise over three months. Given the 30-day annualized volatility of 20.2%, managing levels between the $159.25 support and $185.82 resistance will be key to performance. While there isn't a high valuation burden, a phased approach is recommended, keeping in mind the possibility of multiple adjustments in case of an economic slowdown or weakening demand.
Key Points (3 lines)
- The key point to watch in this period is whether the price maintains above the 20-day moving average ($178.23). If it holds this level, short-term supply and demand can be interpreted favorably.
- A margin of 9.3% and ROE of 7.2% signal that the core business is not weak, but the debt-to-equity ratio (D/E 0.22) requires checking interest rate sensitivity as well.
- A dividend yield of 3.87% and an average payout ratio of 1.0% are the basis for rating dividend sustainability as 'Average'.
Looking at Chevron's (CVX) chart today, rather than making a hasty judgment, it is a wise approach to first decide 'what to confirm before changing positions'.
Investment Thesis (Value)
Chevron's current valuation is close to a reasonable level, considering the possibility of growth deceleration (-6.0%). Maintaining profitability indicators of an operating profit margin of 9.3% and ROE of 7.2%, as long as the multiple assigned by the market does not collapse excessively, the current price will add to its explanatory power over time.
The core argument is 'to what extent can earnings growth (-6.0% negative growth) be justified relative to the current valuation (PER 27.8x, PBR 1.9x)'.
- Growth: Revenue growth rate of -6.0% suggests a potential slowdown in growth.
- Profitability: Operating profit margin of 9.3% and ROE of 7.2% are interpreted as within the normal range or at the lower end.
- Valuation: PER 27.8x and PBR 1.9x are classified as neutral to reasonable in the current period.
- Shareholder Returns: A combination of a 3.87% dividend yield and an average payout ratio of 1.0% is positive for shareholder return attractiveness.
Unique Claim of This Report (Rationale)
- The primary basis for the current judgment is the recent 3-month return of 21.2% and the direction of supply and demand created by the price's position above/below the 20-day moving average ($178.23).
- Financial health is checked by an operating profit margin of 9.3% and ROE of 7.2%; if both these indicators decline simultaneously, the persuasiveness of the investment thesis rapidly weakens.
- Whether the current valuation (PER 27.8x, PBR 1.9x) is excessive compared to the -6.0% growth rate is the key question of this report.
Technical Analysis
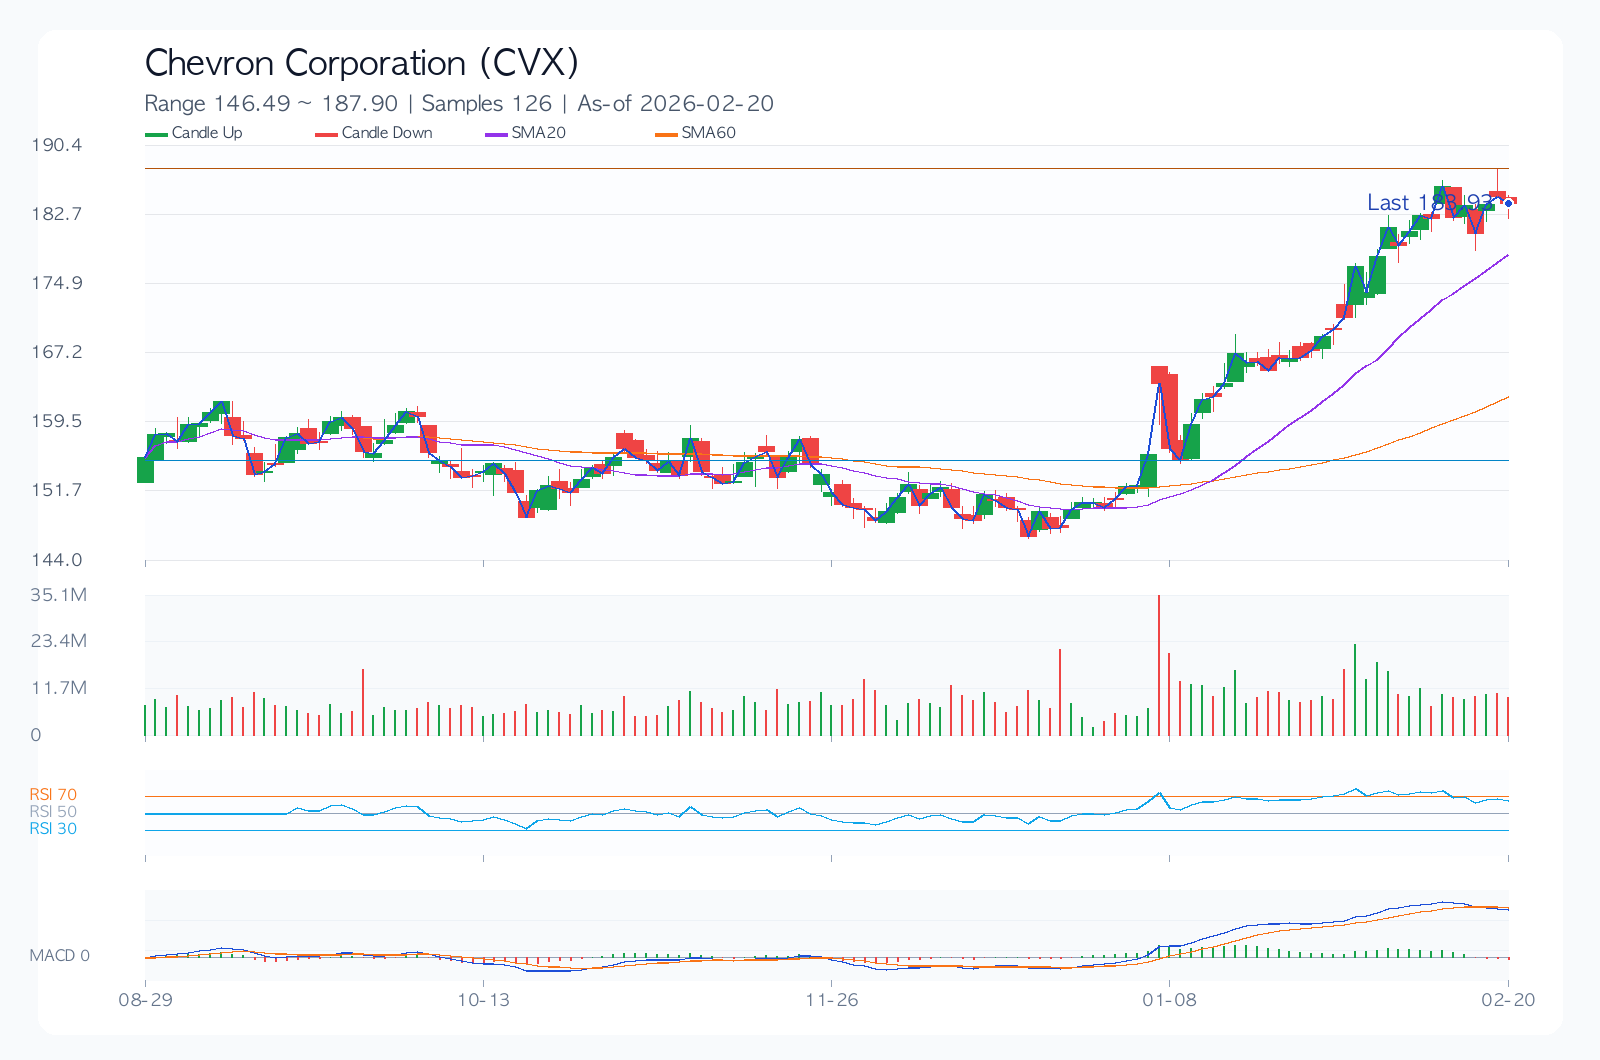
Technically, the current price level is a period where focusing on level management (support 159.25 / resistance 185.82) is more important than hasty chase buying. The direction in which these levels are broken will largely determine short-term performance.
- Trend: The 20-day (178.23), 60-day (162.42), and 120-day (158.84) moving averages are in positive alignment.
- Momentum: 1-month (10.4%), 3-month (21.2%), and 6-month (18.2%) returns suggest medium-term momentum superiority.
- Overbought/Oversold: RSI(14) at 60.9 is located in the neutral zone.
- Volatility/Drawdown: 30-day annualized volatility of 20.2% and maximum drawdown of -20.6% are important criteria for adjusting position size.
- Price Levels: A break of the short-term support at $159.25 or resistance at $185.82 suggests a high probability of trend reversal.
Desk Memo (Light Comment)
Even if it's not a market leader, disciplined investing in quiet periods like this often leads to consistent performance.
Key Chart
Financial Statements/Indicators
| Category | Value |
|---|---|
| Overall Score | 64.9/100 |
| Value/Technical/Risk | 48.0 / 70.0 / 94.0 |
| Current Price | 183.93 |
| 1M/3M/6M Return | 10.4% / 21.2% / 18.2% |
| 30-day Annualized Volatility | 20.2% |
| Maximum Drawdown (MDD) | -20.6% |
| 52-week Range | 133.73 ~ 185.82 |
| 20/60/120-day MA | 178.23 / 162.42 / 158.84 |
| RSI(14) | 60.9 |
| Short-term Support/Resistance | 159.25 / 185.82 |
| Revenue Growth Rate | -6.0% |
| Operating Profit Margin | 9.3% |
| ROE | 7.2% |
| D/E | 0.22 |
| PER / PBR | 27.8 / 1.9 |
| Dividend Yield | 3.9% |
Dividends (History/Sustainability)
The dividend yield (3.87%) is attractive, but what's important is whether the policy can be maintained even when the economy and earnings are unstable. At this point, dividend sustainability is rated as 'Average'.
| Year | DPS | Payout Ratio |
|---|---|---|
| 2022 | 5.68 | 1.0% |
| 2023 | 6.04 | 1.0% |
| 2024 | 6.52 | 1.0% |
| 2025 | 6.84 | 1.0% |
Investment Master Perspective Simulation
The simulation below does not replicate actual investment strategies but applies the core questions of each investment philosophy to current data.
| Perspective | Style Score (0-100) | Key Points Now | Hypothetical Action Scenario |
|---|---|---|---|
| Warren Buffett Perspective (Quality·Margin of Safety) | 28.7 | ROE 7.2%, Operating Profit Margin 9.3%, D/E 0.22, PER 27.8 | Confirm quality but see insufficient margin of safety in price, thus hold |
| Peter Lynch Perspective (Growth·Price Balance) | 0.0 | Revenue Growth Rate -6.0%, PEG-like value 27.78, 6-month Return 18.2% | Story exists, but growth appeal relative to price is deemed weak |
| George Soros Perspective (Trend·Reaction Speed) | 79.8 | 1M/3M Return 10.4%/21.2%, Volatility 20.2%, RSI 60.9 | Seeing this as a period of rapid price reaction, strengthen short-term trading perspective upon catalyst occurrence |
Key Risks
More important than good scenarios is the response to adverse events. For Chevron, changes in valuation (PER 27.8x, PBR 1.9x) and 30-day annualized volatility (20.2%) will be important indicators for judging the speed and intensity of downside risk.
- A low operating profit margin (9.3%) may make profit defense difficult in case of rising costs or intensifying competition.
- Changes in consensus and management guidance comments before and after earnings announcements can dictate short-term stock price direction.
- Regulatory, litigation, and policy changes (trade, antitrust, financial regulations, etc.) can rapidly change the valuation framework.
- Changes in the competitive environment of the core business may weaken market share and profit margin defense capabilities.
Counter-Argument and Invalidation Conditions
The counter-argument is that 'if valuation pressure (PER 27.8x, PBR 1.9x) coincides with concerns about economic slowdown or signs of weakening demand, multiple adjustments could be faster than the pace of earnings improvement'.
- If the price stays below the short-term support of $159.25 for more than 2 weeks, the assumption of the current uptrend is discarded.
- If the next quarter's revenue growth rate decelerates to below 0.0%, the growth thesis needs to be re-evaluated.
- If consensus EPS estimates are downgraded for 4 consecutive weeks after earnings announcements, the baseline scenario is downgraded.
Checklist
Must-watch before next disclosure/earnings
- Need to confirm if the revenue growth rate remains above 0.0% in the next quarter's earnings announcement.
- Need to monitor whether the stock price successfully defends the short-term support of $159.25.
- Need to confirm if consensus EPS estimates show an upward trend for 4 consecutive weeks.
Portfolio Management Memo
While Chevron is not in an overheated zone, the possibility of increased volatility upon event occurrence still exists. Setting clear conditional entry criteria is a more rational approach than chasing the price.
Check before decision-making
- Have you checked the direction of EPS consensus for the next two quarters (up/down)?
- Can the financial structure (D/E, interest coverage ratio, cash flow) withstand an economic slowdown?
- Does the entry price secure a risk-reward ratio of 1:2 or more compared to support/resistance levels?
- Are dividend policies (increase/maintain/decrease) and share repurchase policies consistently maintained?
- Have you predefined the maximum tolerable loss limit in case of a pessimistic scenario?
Conclusion (Optimistic, Baseline, Pessimistic 3 Scenarios)
| Scenario | Assumption | Key Trigger | Target Price (Model) | Expected Return |
|---|---|---|---|---|
| Optimistic | In case of earnings surprise and simultaneous multiple expansion | Accelerated revenue growth and upward guidance revision | 208.51 | 13.4% |
| Baseline | In case earnings meet consensus and multiples maintain current levels | Successful margin defense and maintenance of supply-demand balance | 186.17 | 1.2% |
| Pessimistic | In case of simultaneous earnings deceleration and multiple contraction | Downward guidance revision and expansion of risk premium | 152.66 | -17.0% |
The target price for the baseline scenario is $186.17. However, since the gap between the optimistic scenario (13.4%) and the pessimistic scenario (-17.0%) is quite wide, focusing on 'conditional response' rather than finding 'the answer' is a more effective strategy.
Data Source
- Data Reference Date:
2026-02-20 - Report Generation Date:
2026-02-21 - Stock Original Source: https://finance.yahoo.com/quote/CVX
- Source Data: Yahoo Finance Price/Quote
Related Reports
Recent notes from the same market to compare assumptions.
- JPMorgan Chase(JPM) 289.48 | 3M -8.4% | Vol 26.8% | Risk Management Priority Zone (As of: 2026-03-06) (As-of 2026-03-06)
- Broadcom(AVGO) 330.48 | 3M -13.3% | Vol 37.5% | Entry Timing Check Zone (As of: 2026-03-06) (As-of 2026-03-06)
- Meta Platforms(META) 644.86 | 3M -2.5% | Vol 40.0% | Entry Timing Check Zone (As of: 2026-03-06) (As-of 2026-03-06)
- Exxon Mobil(XOM) 151.21 | 3M +29.1% | Vol 28.3% | Entry Timing Check Zone (As of: 2026-03-06) (As-of 2026-03-06)