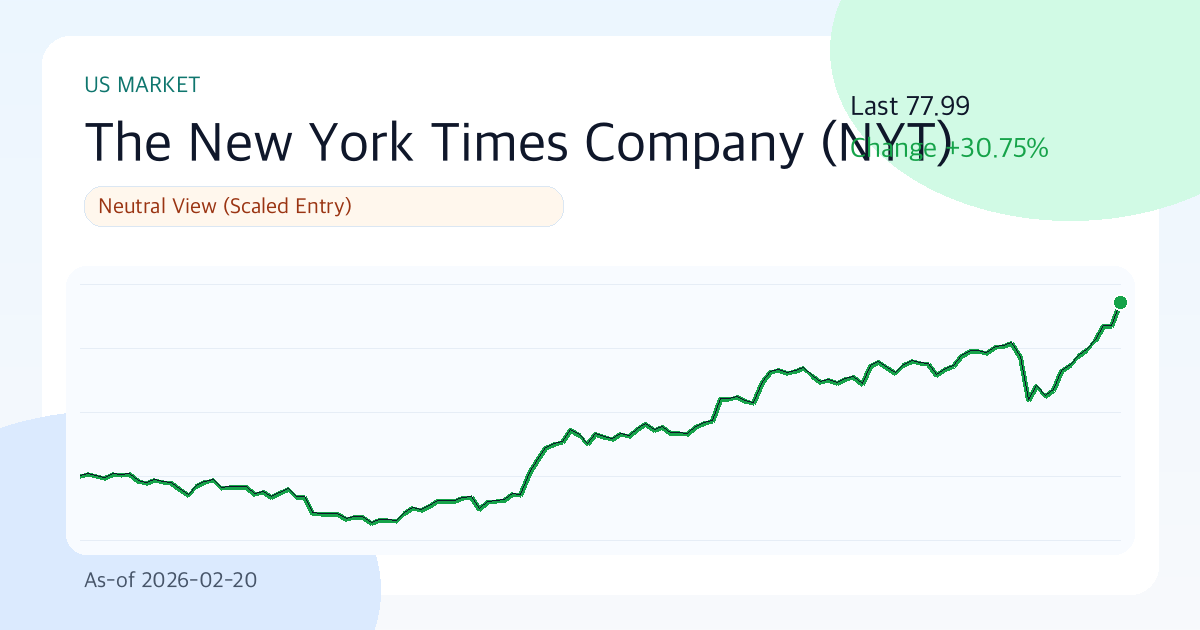
The New York Times (NYT) $77.99 | 3-Month +22.3% | Volatility 27.4% | Entering a Period of Stock Selection (As of: 2026-02-20)
Summary
- One-Line Judgment: Neutral Stance (Phased Approach)
- Confidence Level: High
- Comment: The New York Times (NYT) is currently trading around $77.99. While a 3-month return of 22.3% indicates positive short-term momentum, a volatility of 27.4% necessitates a cautious approach. Future earnings improvements over the next 1-2 quarters will be the key determinant of the stock's direction.
Key Points (3 Lines)
- The primary focus for this period is whether the price stabilizes above the 20-day moving average ($72.34). If this level holds as support, short-term supply and demand dynamics are likely to be positive.
- A profit margin of 20.6% and an ROE of 17.6% suggest a solid business foundation, but a 0% debt ratio means sensitivity to interest rate fluctuations must also be considered.
- With a dividend yield of 1.2% and an average payout ratio of 40.7%, the company's dividend-paying capacity is assessed as 'Good'.
The current stock price trend of The New York Times requires reading beyond the numbers to understand its rhythm. This is a neutral phase where defining "under what conditions should my opinion change?" is more important than asserting conviction.
Investment Thesis (Value)
The key to success in this period lies in maintaining both growth and profitability. As long as The New York Times' earnings generation capability is not compromised and the market's multiple assigned to those earnings (P/E 37.3x, P/B 6.4x) does not collapse rapidly, the current valuation can be justified over time.
The core question is: "Can the solid financial health (operating margin 20.6%, ROE 17.6%) and recent price momentum (3-month return 22.3%) drive further stock price re-evaluation in the next 1-2 quarters?"
- Growth: A revenue growth rate of 11.5% indicates ongoing top-line expansion.
- Profitability: An operating margin of 20.6% and an ROE of 17.6% are indicators of top-tier competitiveness within the industry.
- Valuation: A P/E of 37.3x and a P/B of 6.4x signify a high valuation in the current market.
- Cash Return: A dividend yield of 1.2% and a payout ratio of 40.7% offer limited appeal from a shareholder return perspective.
Unique Argument of This Article (Basis)
- The most critical criteria for judging the current price are its position above/below the 20-day moving average ($72.34) and the direction of supply and demand dynamics around it.
- Financial metrics such as an operating margin of 20.6% and an ROE of 17.6% demonstrate the soundness of the core business, but a decline in these figures could undermine the investment thesis.
- The core of this analysis is whether the valuation of P/E 37.3x and P/B 6.4x is excessive compared to the 11.5% growth rate.
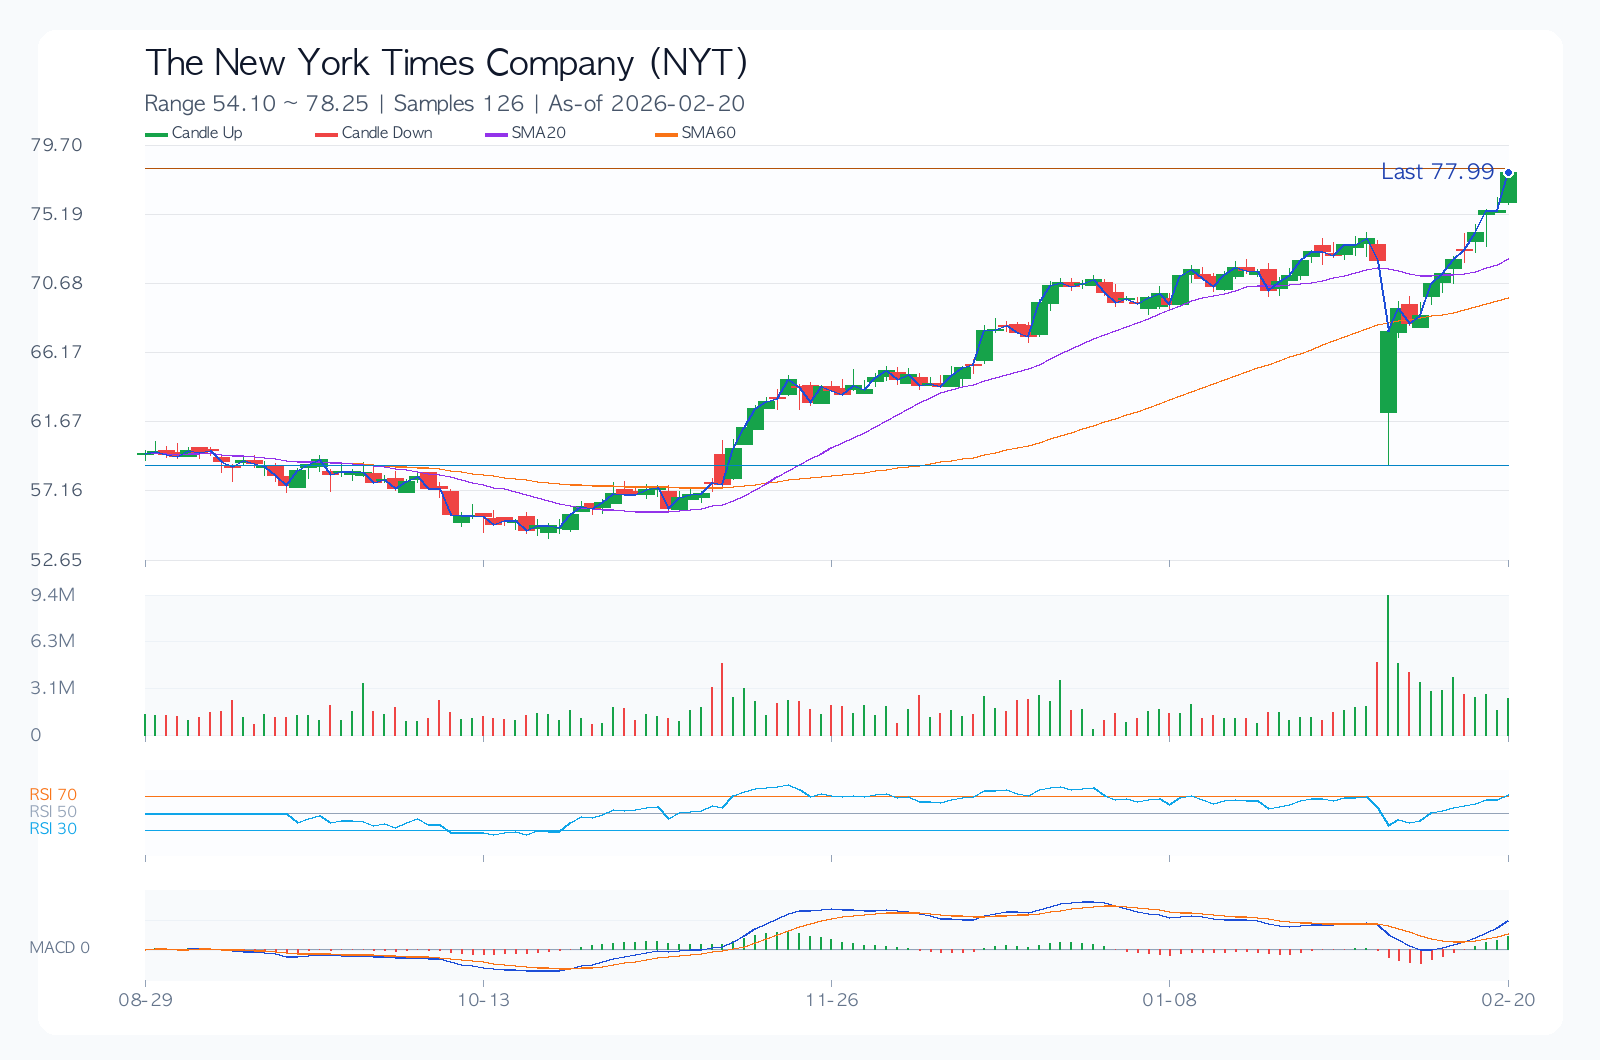
Technical Analysis
Technically, the current price range is a point where conviction and doubt intersect. Precise level management (support at $67.63, resistance at $77.99) is more likely to determine performance than chasing the rally.
- Trend: The 20-day, 60-day, and 120-day moving averages ($72.34, $69.84, $64.10) are in a positive alignment, laying the foundation for an upward trend.
- Momentum: Recent returns of 9.4% (1-month), 22.3% (3-month), and 30.7% (6-month) show strong short-to-medium term upward momentum.
- Overbought/Oversold: The RSI (14) is at 62.4, remaining in neutral territory, neither overbought nor oversold.
- Volatility/Drawdown: 30-day annualized volatility is 27.4%, and the maximum drawdown is -20.2%. These figures should be used as important benchmarks for adjusting portfolio weightings.
- Price Levels: A trend reversal is likely when the price breaks through or falls below the short-term support level of $67.63 or the resistance level of $77.99.
Desk Memo (Light Commentary)
Even without dramatic surges and drops, adhering to principles in these everyday market conditions leads to consistent performance.
Key Chart
Financial Statements & Indicators
| Metric | Value |
|---|---|
| Overall Score | 67.0/100 |
| Value/Technical/Risk | 55.0 / 69.3 / 90.0 |
| Current Price | $77.99 |
| 1M/3M/6M Return | 9.4% / 22.3% / 30.8% |
| 30-Day Annualized Volatility | 27.4% |
| Max Drawdown (MDD) | -20.2% |
| 52-Week Range | $45.37 ~ $77.99 |
| 20/60/120-Day MA | $72.34 / $69.84 / $64.10 |
| RSI(14) | 62.4 |
| Short-Term Support/Resistance | $67.63 / $77.99 |
| Revenue Growth | 11.5% |
| Operating Margin | 20.6% |
| ROE | 17.6% |
| D/E | 0.00 |
| P/E / P/B | 37.3 / 6.4 |
| Dividend Yield | 1.2% |
Dividends (History & Sustainability)
The true value of a dividend lies not just in its yield but in how consistently the policy is maintained amidst economic volatility. The New York Times' dividend sustainability is assessed as 'Good'.
| Year | DPS | Payout Ratio |
|---|---|---|
| 2022 | $0.34 | 40.7% |
| 2023 | $0.42 | 40.7% |
| 2024 | $0.50 | 40.7% |
| 2025 | $0.67 | 40.7% |
Investor Legend Perspective Simulation
This simulation is merely an exercise applying the core questions of a specific investment philosophy to current data; it does not replicate the actual trading of these legends.
| Perspective | Style Score (0-100) | Current Observation | Hypothetical Action Scenario |
|---|---|---|---|
| Warren Buffett (Quality/Margin of Safety) | 33.0 | ROE 17.6%, Operating Margin 20.6%, D/E 0.00, P/E 37.3x | Quality confirmed, but insufficient margin of safety in price; hold. |
| Peter Lynch (Growth/Price Balance) | 41.5 | Revenue Growth 11.5%, PEG Ratio approx. 3.25, 6-Month Return 30.8% | Story exists, but growth appeal relative to price is weak. |
| George Soros (Trend/Speed of Reaction) | 76.5 | 1M/3M Returns 9.4%/22.3%, Volatility 27.4%, RSI 62.4 | Price is reacting quickly; potential for short-term trading if catalysts emerge. |
Key Risks
More important than the best-case scenario is preparedness for the worst. For The New York Times, current risk management is like a seatbelt for maintaining a position. Close attention must be paid to the valuation (P/E 37.3x, P/B 6.4x) burden and changes in 30-day annualized volatility (27.4%).
- The high valuation of P/E 37.3x could lead to significant multiple contraction pressure if earnings falter.
- During earnings seasons, short-term volatility may increase based on changes in consensus estimates and management guidance commentary.
- Unexpected regulatory changes, lawsuits, or government policy shifts (trade, antitrust, financial, etc.) could shake the valuation framework itself.
- Intensifying competition in core business segments risks weakening the ability to defend market share and profitability.
Counterarguments and Invalidation Conditions
The counterargument is clear: if the valuation burden (P/E 37.3x, P/B 6.4x) is significant, or if demand slowdown becomes visible, multiple compression could outweigh earnings improvement, driving stock price decline.
- If the stock price remains below the short-term support level of $67.63 for more than two weeks, the current upward trend assumption must be discarded.
- If the next quarter's revenue growth slows to below 8.5%, a reassessment of growth prospects is inevitable.
- If market consensus EPS estimates are revised downwards for four consecutive weeks after an earnings announcement, the base case scenario should be lowered.
Checklist
Must-See Before Next Disclosure/Earnings
- It is crucial to confirm whether next quarter's revenue growth rate maintains at least 9.5% during the upcoming earnings announcement.
- Closely monitor whether the stock price successfully defends the short-term support level of $67.63.
- Check for a positive trend where market consensus EPS estimates are revised upwards for four consecutive weeks.
Portfolio Management Notes
While not an environment of extreme volatility, price fluctuations around events cannot be ignored. It is wiser to establish clear conditional entry criteria rather than betting on a direction at this time.
Pre-Decision Checks
- Have you confirmed whether the EPS consensus estimates for the next two quarters are trending upwards or downwards?
- Can the core business maintain its financial soundness (debt ratio, interest coverage, cash flow) even during an economic slowdown?
- Does the entry price secure a risk-reward ratio of at least 1:2 relative to the support level?
- Are dividend payments (increases, maintenance, reductions) and share buyback policies consistently implemented?
- Have you clearly defined the maximum acceptable loss in the event of a pessimistic scenario occurring?
Conclusion (Optimistic, Base, Pessimistic 3 Scenarios)
| Scenario | Assumption | Key Trigger | Target Price (Model) | Expected Return |
|---|---|---|---|---|
| Optimistic | Scenario where earnings surprise and valuation multiples rise concurrently. | Acceleration in revenue growth and upward revision of management guidance. | $89.46 | 14.7% |
| Base | Scenario where earnings meet market expectations and valuation multiples remain at current levels. | Maintenance of operating margin and stable supply/demand conditions. | $79.87 | 2.4% |
| Pessimistic | Scenario where earnings slowdown and valuation multiples decline concurrently are feared. | Downward revision of management guidance and expansion of risk premium. | $65.49 | -16.0% |
The base case target price is $79.87. However, the gap between the optimistic scenario (14.7% upside) and the pessimistic scenario (-16.0% downside) is substantial. Therefore, focusing on "conditional response" rather than finding a "correct answer" seems more appropriate for this stock.
Data Sources
- Data As Of:
2026-02-20 - Report Generated On:
2026-02-22 - Original Source: https://finance.yahoo.com/quote/NYT
- Source Data: Yahoo Finance Price/Quote
Related Reports
Recent notes from the same market to compare assumptions.
- JPMorgan Chase(JPM) 289.48 | 3M -8.4% | Vol 26.8% | Risk Management Priority Zone (As of: 2026-03-06) (As-of 2026-03-06)
- Broadcom(AVGO) 330.48 | 3M -13.3% | Vol 37.5% | Entry Timing Check Zone (As of: 2026-03-06) (As-of 2026-03-06)
- Meta Platforms(META) 644.86 | 3M -2.5% | Vol 40.0% | Entry Timing Check Zone (As of: 2026-03-06) (As-of 2026-03-06)
- Exxon Mobil(XOM) 151.21 | 3M +29.1% | Vol 28.3% | Entry Timing Check Zone (As of: 2026-03-06) (As-of 2026-03-06)