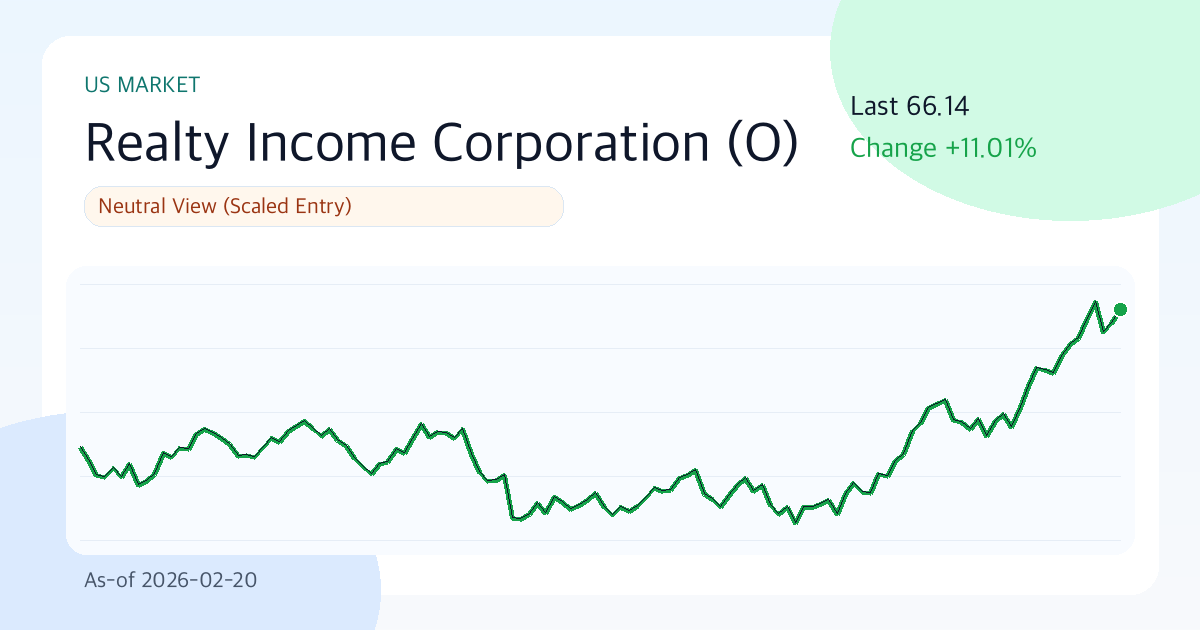
Realty Income (O) 66.14 | 3-Month +16.6% | Volatility 16.0% | Entry Timing Hinges on 'Conditional Response' (As of: 2026-02-20)
Summary
- One-Line Judgment: Neutral Outlook (Phased Approach)
- Confidence Level: High
- Comment: With an overall score of 65.9, the assessment breaks down as Value 57.0, Technicals 63.5, and Risk 90.0. The current price of 66.14, within a 30-day volatility range of 16.0%, suggests a time to consider a phased entry. We will closely monitor movements within the short-term support at 58.17 and resistance at 66.49.
Key Points (3 Lines)
- The primary focus for this period is whether the price can remain above the 20-day moving average (63.01). If it holds this level, short-term supply and demand dynamics are likely to be favorable.
- The combination of a 44.5% operating profit margin and a 2.5% ROE suggests solid core business strength, but the debt-to-equity ratio (D/E 0.75) requires consideration of interest rate sensitivity.
- Considering a dividend yield of 4.9% and an average payout ratio of 3.0%, the sustainability of dividends is assessed as 'Good'.
Looking at Realty Income's chart today, the 'rhythm' beyond the numbers is what first catches the eye. This is a period where favorable trends and calm waves coexist, making it wise to clearly define 'under what conditions the response will change' rather than making hasty judgments.
Investment Thesis (Value)
The key at this juncture is whether growth and profitability are simultaneously supported. If Realty Income's earnings power is maintained and the market multiple (PER 61.8, PBR 1.6) does not experience an excessive decline, the current valuation may be perceived as reasonable over time.
The core question is whether the combination of 'solid financial strength (operating profit margin 44.5%, ROE 2.5%) and current price momentum (3-month +16.6%)' can drive a stock re-rating over the next 1-2 quarters. Despite valuation concerns, this is a time to focus on whether improving growth and profitability can offset these.
- Growth: A revenue growth rate of 10.3% indicates an expansion phase.
- Profitability: An operating profit margin of 44.5% and ROE of 2.5% can be interpreted as within the normal range or at the lower end.
- Valuation: PER 61.8 and PBR 1.6 are classified as being in an overvalued territory compared to the market average.
- Capital Returns: The combination of an average payout ratio of 3.0% and a dividend yield of 4.9% is a positive factor enhancing shareholder return attractiveness.
Unique Argument of This Report (Rationale)
- The primary basis for the current judgment is the supply and demand directionality created by the 3-month return of 16.6% and movements above/below the 20-day moving average (63.01).
- Financial strength is assessed through an operating profit margin of 44.5% and ROE of 2.5%; if both indicators decline simultaneously, the reliability of the investment thesis will rapidly diminish.
- The discrepancy between valuation metrics (PER 61.8, PBR 1.6) and the 10.3% growth rate is the core question of this report.
Technical Analysis
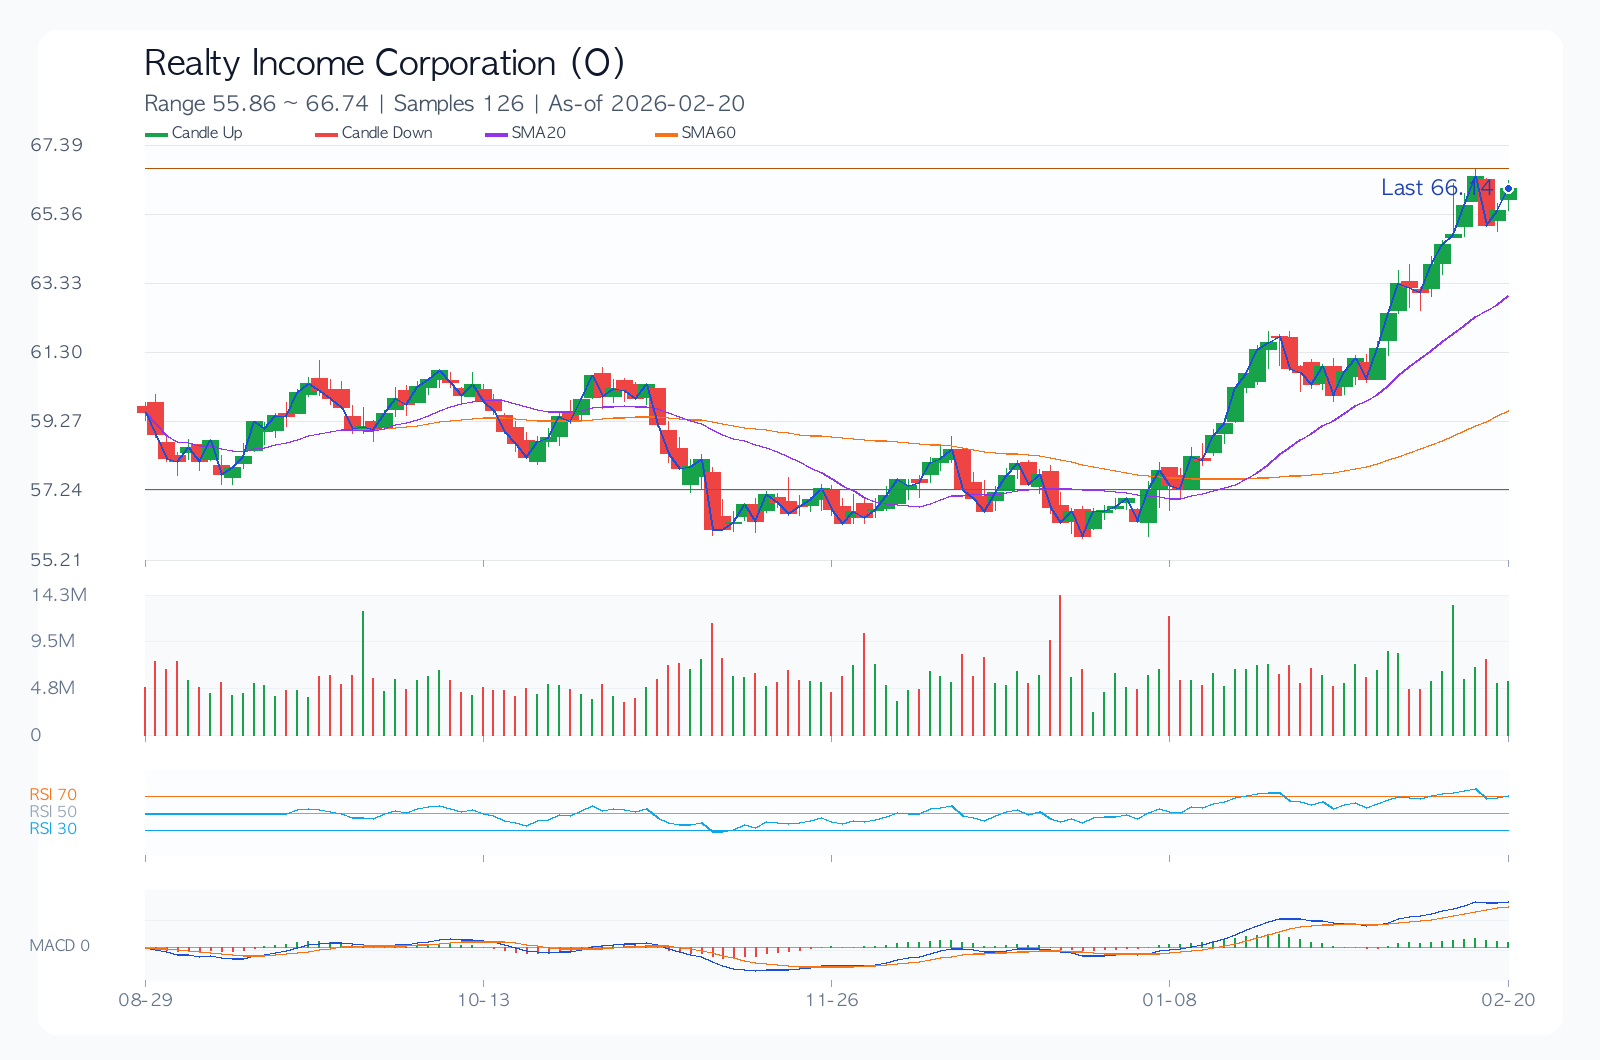
Technically, the upward momentum has already moved ahead somewhat. Therefore, rather than aggressive chasing, managing levels – specifically, responding at support (58.17) and resistance (66.49) – is more likely to determine performance.
- Trend: The 20/60/120-day moving averages (63.01/59.63/59.21) are in a positive, upward-trending arrangement.
- Momentum: With 1-month at 8.7%, 3-month at 16.6%, and 6-month at 11.0%, short-to-medium term momentum is dominant.
- Overbought/Oversold: The RSI(14) index at 75.9 is approaching overbought territory.
- Volatility/Drawdown: 30-day annualized volatility of 16.0% and a maximum drawdown of -20.2% should be used as important benchmarks for position sizing.
- Price Levels: The breakout or breakdown of the short-term support at 58.17 and resistance at 66.49 could signal a trend reversal.
Desk Memo (Light Commentary)
The current chart temperature is somewhat high. Chasing buys could lead to a "speeding ticket," so it's not too late to enter after confirming a pullback.
Key Chart
Financial Statements & Indicators
| Metric | Value |
|---|---|
| Overall Score | 65.9/100 |
| Value/Technicals/Risk | 57.0 / 63.5 / 90.0 |
| Current Price | 66.14 |
| 1M/3M/6M Return | 8.7% / 16.6% / 11.0% |
| 30-Day Annualized Volatility | 16.0% |
| Max Drawdown (MDD) | -20.1% |
| 52-Week Range | 52.27 ~ 66.49 |
| 20/60/120-Day MA | 63.01 / 59.63 / 59.21 |
| RSI(14) | 75.9 |
| Short-Term Support/Resistance | 58.17 / 66.49 |
| Revenue Growth Rate | 10.3% |
| Operating Profit Margin | 44.5% |
| ROE | 2.5% |
| D/E | 0.75 |
| PER / PBR | 61.8 / 1.6 |
| Dividend Yield | 4.9% |
Dividends (History & Sustainability)
While the dividend yield itself is important, its sustainability during economic downturns or performance fluctuations is more critical. It is currently assessed as 'Good'.
| Year | DPS | Payout Ratio |
|---|---|---|
| 2022 | 2.97 | 3.0% |
| 2023 | 3.06 | 3.0% |
| 2024 | 2.87 | 3.0% |
| 2025 | 3.49 | 3.0% |
Investment Guru Perspective Simulation
The following simulations do not replicate actual investment cases but apply the core questions of each investment philosophy to the current data.
| Perspective | Style Score (0-100) | Current Focus | Hypothetical Action Scenario |
|---|---|---|---|
| Warren Buffett (Quality/Margin of Safety) | 23.2 | ROE 2.5%, Operating Margin 44.5%, D/E 0.75, PER 61.8 | Quality confirmed, but insufficient price margin of safety; hold. |
| Peter Lynch (Growth/Price Balance) | 0.0 | Revenue Growth 10.3%, PEG Ratio ~6.00, 6-Month Return 11.0% | Story exists, but growth appeal relative to price is weak. |
| George Soros (Trend/Reaction Speed) | 74.7 | 1M/3M Returns 8.7%/16.6%, Volatility 16.0%, RSI 75.9 | Price reaction is rapid; strengthen short-term trading perspective upon catalyst emergence. |
Key Risks
Managing downside risk is more crucial than the success scenario. For Realty Income, current risk management is less about warnings and more about essential safeguards for position defense. Specifically, movements in valuation (PER 61.8, PBR 1.6) and 30-day volatility (16.0%) can dictate the speed of downside risk.
- The overvaluation concern at a PER of 61.8 could exert downward pressure on multiples in case of an earnings miss.
- Changes in consensus estimates and guidance commentary before/after earnings announcements can determine short-term stock direction.
- Unforeseen regulatory changes, lawsuits, or policy shifts (trade, financial, etc.) could rapidly alter the valuation framework.
- There is an inherent risk of weakening market share and profit margin defense due to changes in core business competitive intensity.
Counterarguments and Invalidation Conditions
Conversely, if valuation concerns (PER 61.8, PBR 1.6) are significant or demand slowdown becomes apparent, the pace of stock multiple adjustment could outstrip earnings improvement. In such a scenario, the current overvaluation thesis may lose its strength.
- If the price remains below the short-term support level of 58.17 for more than two weeks, the current upward trend assumption will be considered invalid.
- If the next quarter's revenue growth rate slows to below 7.3%, the growth assumption requires re-evaluation.
- If consensus EPS is revised downwards for four consecutive weeks after the earnings release, the base scenario will be lowered.
Checklist
Must-Watch Items Before Next Disclosure/Earnings
- Confirm that the revenue growth rate remains above 8.3% at the next quarterly earnings announcement.
- Closely monitor whether the stock price successfully defends the short-term support level of 58.17.
- Check if the trend of consensus EPS estimates is being revised upwards for four consecutive weeks.
Portfolio Management Notes
While volatility itself is not in an overheated zone, movements can increase around events. As the technicals are approaching an overheated region, entering after confirming a pullback is a more favorable strategy in terms of risk-reward ratio than chasing.
Pre-Decision Checks
- Have the future 2-quarter EPS consensus direction (upward/downward) been clearly understood?
- Can the financial structure (D/E, interest coverage, cash flow) remain stable even during an economic slowdown?
- Does the entry price secure a risk-reward ratio of at least 1:2 relative to support/resistance levels?
- Are dividend policies (increase/maintain/decrease) and share buyback policies consistently maintained?
- Has the maximum acceptable loss limit in case of a pessimistic scenario been pre-defined?
Conclusion (Optimistic, Base, Pessimistic 3 Scenarios)
| Scenario | Assumption | Key Trigger | Target Price (Model) | Expected Return |
|---|---|---|---|---|
| Optimistic | Earnings surprise coupled with multiple expansion | Accelerating revenue growth and upward guidance revision | 75.65 | 14.4% |
| Base | Earnings meet consensus, multiples remain at current levels | Stable margin maintenance and neutral supply/demand | 67.55 | 2.1% |
| Pessimistic | Earnings slowdown coupled with multiple contraction | Downward guidance revision and widening risk premium | 55.39 | -16.3% |
The base scenario target price is 67.55. However, given the wide gap between the optimistic target (14.4%) and the pessimistic scenario (-16.3%), it is more rational to focus on 'conditional response' rather than finding a 'correct answer' for this stock.
Data Sources
- Data As Of:
2026-02-20 - Report Generated On:
2026-02-21 - Original Stock Link: https://finance.yahoo.com/quote/O
- Source Data: Yahoo Finance Price/Quote
Related Reports
Recent notes from the same market to compare assumptions.
- JPMorgan Chase(JPM) 289.48 | 3M -8.4% | Vol 26.8% | Risk Management Priority Zone (As of: 2026-03-06) (As-of 2026-03-06)
- Broadcom(AVGO) 330.48 | 3M -13.3% | Vol 37.5% | Entry Timing Check Zone (As of: 2026-03-06) (As-of 2026-03-06)
- Meta Platforms(META) 644.86 | 3M -2.5% | Vol 40.0% | Entry Timing Check Zone (As of: 2026-03-06) (As-of 2026-03-06)
- Exxon Mobil(XOM) 151.21 | 3M +29.1% | Vol 28.3% | Entry Timing Check Zone (As of: 2026-03-06) (As-of 2026-03-06)