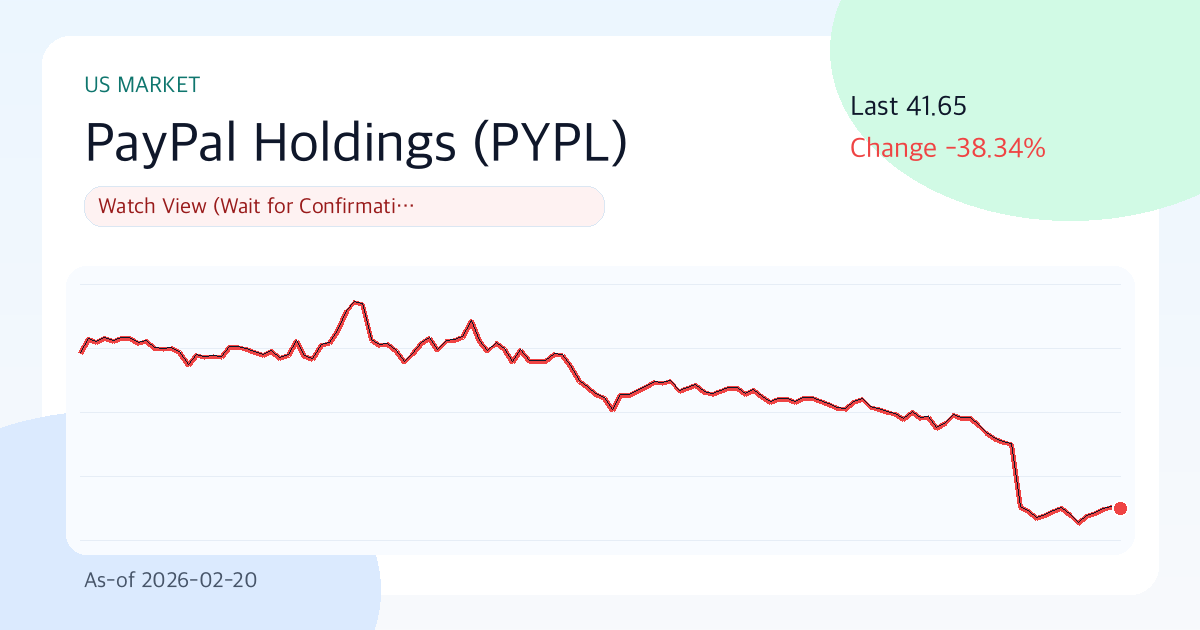
PayPal Holdings (PYPL) 41.65 | 3M -30.7% | Vol 62.9% | Risk Management Priority Zone (As of: 2026-02-20)
Summary
- One-line judgment: Wait-and-see approach (Respond after confirmation)
- Confidence level: Moderate
- Comment: PayPal Holdings (PYPL) is currently trading at $41.65, down -30.7% over the past three months with 62.9% volatility. While the valuation is attractive, a lack of technical momentum suggests a 'wait-and-see' approach is warranted. Financial health is sound, but caution is advised regarding market volatility.
Key Points (3 Lines)
- The key point to watch in this period is whether the price remains above the 20-day moving average ($45.60). If it does, short-term supply and demand dynamics are likely to be favorable.
- The combination of a 17.5% margin and 25.7% ROE signals that core business strength is not weak, but the D/E ratio of 0.61 requires monitoring interest rate sensitivity.
- Based on a dividend yield of 1.3% and an average payout ratio of 2.6%, dividend sustainability is rated 'Good'.
Looking at PayPal Holdings' chart today, rhythm is more apparent than numbers. The current period is characterized by both rough currents and high waves, making it more advantageous to pre-determine 'under what conditions the judgment will change' rather than rushing to conclusions.
Investment Thesis (Value)
In periods of weak momentum, the quality of numbers must be scrutinized more rigorously than the story. If PayPal Holdings' earnings quality is maintained and the market's valuation of those earnings (PER 7.7, PBR 1.9) does not excessively collapse, the current valuation will gain explanatory power over time. However, a revenue growth rate of 3.7% suggests potential for a slowdown.
The core thesis is whether the combination of 'financial strength (17.5% margin, 25.7% ROE) and current price momentum (-30.7% over 3 months)' can lead to a re-rating in the next 1-2 quarters. The key dilemma is whether this valuation is excessive relative to the 3.7% growth rate.
- Growth: Revenue growth rate of 3.7% suggests potential for a slowdown.
- Profitability: An operating margin of 17.5% and ROE of 25.7% can be interpreted as potentially top-tier within the industry.
- Valuation: PER of 7.7 and PBR of 1.9 are classified as neutral to reasonable.
- Capital Return: The combination of an average payout ratio of 2.6% and a dividend yield of 1.3% limits shareholder return attractiveness.
Unique Argument of This Report (Basis)
- The primary basis for the current judgment is the supply and demand directionality created by the recent 3-month return of -30.7% and the price's position relative to the 20-day moving average ($45.60).
- Financial strength is assessed by the operating margin of 17.5% and ROE of 25.7%; if both of these decline simultaneously, the investment thesis quality will rapidly weaken.
- The valuation metrics are PER 7.7 and PBR 1.9, and the core of this report is the question of 'whether this valuation is excessive relative to the 3.7% growth rate.'
Technical Analysis
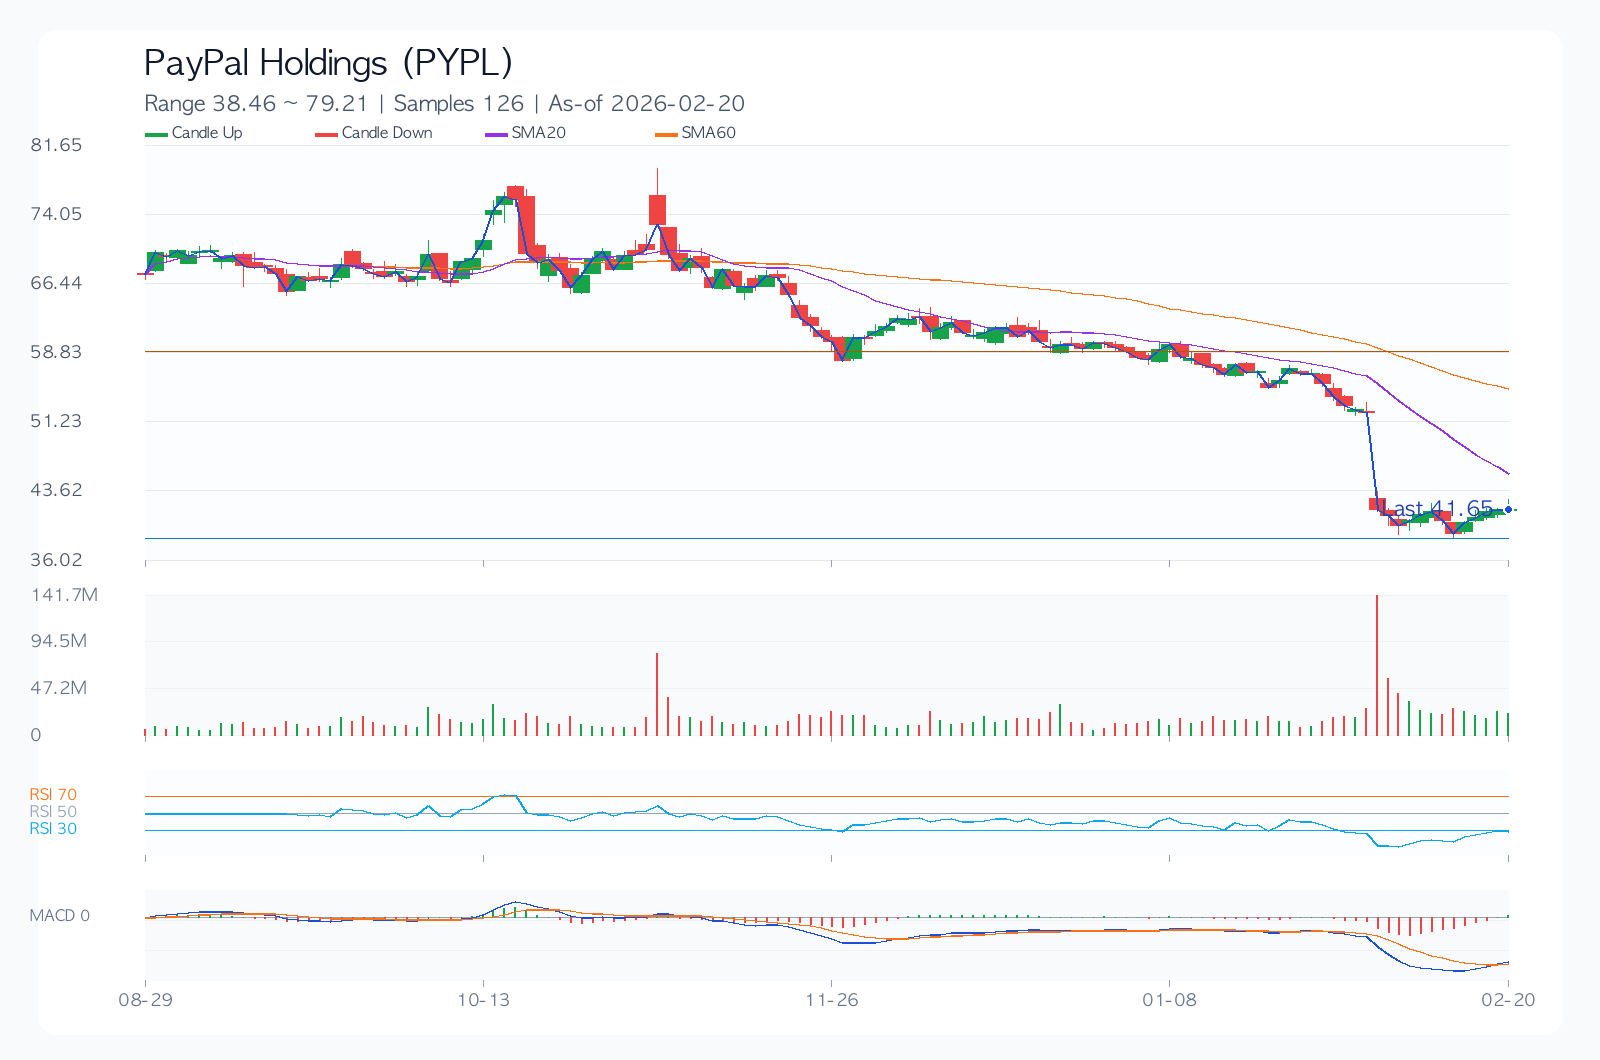
Technically, this is a point where fear has reacted first. An RSI (14) of 21.7 indicates oversold conditions. Therefore, level management (support $39.08 / resistance $58.27) is likely to account for most of the performance, rather than chasing. Whether the price stays above the 20-day moving average ($45.60) is the immediate barometer of short-term supply and demand.
- Trend: The 20-day, 60-day, and 120-day moving averages are at $45.60, $54.97, and $61.39, respectively, indicating a mixed or inverse arrangement.
- Momentum: 1-month -27.1%, 3-month -30.7%, 6-month -38.3%, showing directional uncertainty.
- Overbought/Oversold: RSI (14) at 21.7 is approaching oversold territory.
- Volatility/Drawdown: 30-day annualized volatility of 62.9% and maximum drawdown of -57.4% should be used as benchmarks for position sizing.
- Price Levels: The potential for trend reversal is high when breaking below short-term support at $39.08 or above resistance at $58.27.
Desk Memo (Light Commentary)
Today's market is one where stop-loss rules are needed before coffee. Given the high volatility, simply reducing position size can significantly lower return fluctuations. 30-day annualized volatility of 62.9% represents a 'high-risk of loss' period.
Key Chart
Financial Statements & Indicators
| Category | Value |
|---|---|
| Overall Score | 50.9/100 |
| Value/Technical/Risk | 64.8 / 14.1 / 84.0 |
| Current Price | 41.65 |
| 1M/3M/6M Return | -27.1% / -30.7% / -38.3% |
| 30-Day Annualized Volatility | 62.9% |
| Max Drawdown (MDD) | -57.4% |
| 52-Week Range | 39.08 ~ 78.22 |
| 20/60/120-Day MA | 45.60 / 54.97 / 61.39 |
| RSI(14) | 21.7 |
| Short-Term Support/Resistance | 39.08 / 58.27 |
| Revenue Growth Rate | 3.7% |
| Operating Margin | 17.5% |
| ROE | 25.7% |
| D/E | 0.61 |
| PER / PBR | 7.7 / 1.9 |
| Dividend Yield | 1.3% |
Dividends (History & Sustainability)
More important than the dividend yield itself is whether the policy is maintained even when the economy and earnings fluctuate. The current assessment is 'Good,' with limited shareholder return attractiveness.
| Year | DPS | Payout Ratio |
|---|---|---|
| 2022 | 0.00 | 2.6% |
| 2023 | 0.00 | 2.6% |
| 2024 | 0.00 | 2.6% |
| 2025 | 0.14 | 2.6% |
Investment Guru Perspective Simulation
The following content is not a replication of actual guru trades but a style simulation applying the core questions of each investment philosophy to current data.
| Perspective | Style Score (0-100) | Current Focus | Hypothetical Action Scenario |
|---|---|---|---|
| Warren Buffett (Quality & Margin of Safety) | 67.3 | ROE 25.7%, Operating Margin 17.5%, D/E 0.61, PER 7.7 | Maintain on watch list, approach waiting for valuation adjustment period |
| Peter Lynch (Growth & Price Balance) | 33.1 | Revenue Growth Rate 3.7%, PEG-like ratio 2.08, 6-month Return -38.3% | Story exists, but growth attractiveness relative to price is weak |
| George Soros (Trend & Reaction Speed) | 0.0 | 1M/3M Returns -27.1%/-30.7%, Volatility 62.9%, RSI 21.7 | Trend reliability is low; wait for signal confirmation before acting, only respond to reversal signs |
Key Risks
More important than a good scenario is how to respond when a bad scenario occurs. For PayPal Holdings, the current risk statement is not a warning but closer to a safety net for protecting positions. In the current phase, changes in valuation metrics (PER 7.7, PBR 1.9) and 30-day annualized volatility (62.9%) can significantly influence the speed of downside risk. The risk of breaking psychological lows should also be considered if a deep downtrend resumes.
- With annualized volatility at 62.9%, rapid fluctuations are possible before and after events, making stop-loss rules essential.
- Given the recent maximum drawdown of -57.4% based on time series, there is a risk of breaking psychological lows if the downtrend resumes.
- Changes in consensus estimates and guidance comments before and after earnings announcements can influence short-term direction.
- Valuation frameworks can change rapidly due to regulations, lawsuits, or policy changes (trade/antitrust/financial regulations, etc.).
Contrarian Argument and Invalidation Conditions
The contrarian argument is that 'if valuation burden (PER 7.7, PBR 1.9) or demand slowdown is confirmed, multiple contraction may outpace earnings improvement.' In particular, if earnings decline, the current valuation may appear expensive.
- If the price remains below the short-term support level of $39.08 for more than two weeks, the current trend assumption will be considered invalid.
- If the next quarter's revenue growth rate slows to below 0.7%, the growth assumption needs re-evaluation.
- If the consensus EPS is revised downwards for four consecutive weeks after the earnings announcement, the base scenario will be lowered.
Checklist
Must-See Before Next Disclosure/Earnings
- Confirm if revenue growth rate is maintained at 1.7% or higher in the next quarterly earnings.
- Confirm if the stock price defends the short-term support level of $39.08.
- Confirm if consensus EPS estimates are revised upwards for four consecutive weeks.
Portfolio Management Memo
Concentrating on a single stock is not recommended due to high volatility. While a rebound signal may appear as it's in an oversold technical zone, a conservative approach to pre-emptive buying before trend confirmation is advisable. Prioritize securing a risk-reward ratio of 1:2 or higher upon entry.
Pre-Decision Checks
- Have the direction of consensus EPS for the next two quarters (upward/downward) been confirmed?
- Can the financial structure (D/E, interest coverage, cash flow) withstand an economic slowdown?
- Does the entry price secure a risk-reward ratio of 1:2 or higher relative to support/resistance levels?
- Are dividend policy (increase/maintain/decrease) and share buyback policies consistently followed?
- Has the maximum acceptable loss been pre-defined in case of a pessimistic scenario?
Conclusion (Optimistic, Base, Pessimistic 3 Scenarios)
| Scenario | Assumption | Key Trigger | Target Price (Model) | Expected Return |
|---|---|---|---|---|
| Optimistic | Earnings surprise combined with multiple defense | Acceleration of revenue growth rate + upward revision of guidance | 44.72 | 7.4% |
| Base | Earnings meet consensus, multiples remain neutral | Margin defense + neutral supply/demand | 39.93 | -4.1% |
| Pessimistic | Earnings slowdown and multiple contraction occur simultaneously | Downward revision of guidance + expansion of risk premium | 32.74 | -21.4% |
The target price for the base scenario is $39.93. However, given the wide gap between the optimistic (7.4%) and pessimistic (-21.4%) scenarios, it is reasonable to view this stock as requiring 'conditional response' rather than a 'definitive answer.' If the price remains below the short-term support level of $39.08 for more than two weeks, the current trend assumption will be considered invalid.
Data Sources
- Data as of:
2026-02-20 - Report Generation Date:
2026-02-21 - Original Stock Link: https://finance.yahoo.com/quote/PYPL
- Source Data: Yahoo Finance Price/Quote
Related Reports
Recent notes from the same market to compare assumptions.
- JPMorgan Chase(JPM) 289.48 | 3M -8.4% | Vol 26.8% | Risk Management Priority Zone (As of: 2026-03-06) (As-of 2026-03-06)
- Broadcom(AVGO) 330.48 | 3M -13.3% | Vol 37.5% | Entry Timing Check Zone (As of: 2026-03-06) (As-of 2026-03-06)
- Meta Platforms(META) 644.86 | 3M -2.5% | Vol 40.0% | Entry Timing Check Zone (As of: 2026-03-06) (As-of 2026-03-06)
- Exxon Mobil(XOM) 151.21 | 3M +29.1% | Vol 28.3% | Entry Timing Check Zone (As of: 2026-03-06) (As-of 2026-03-06)