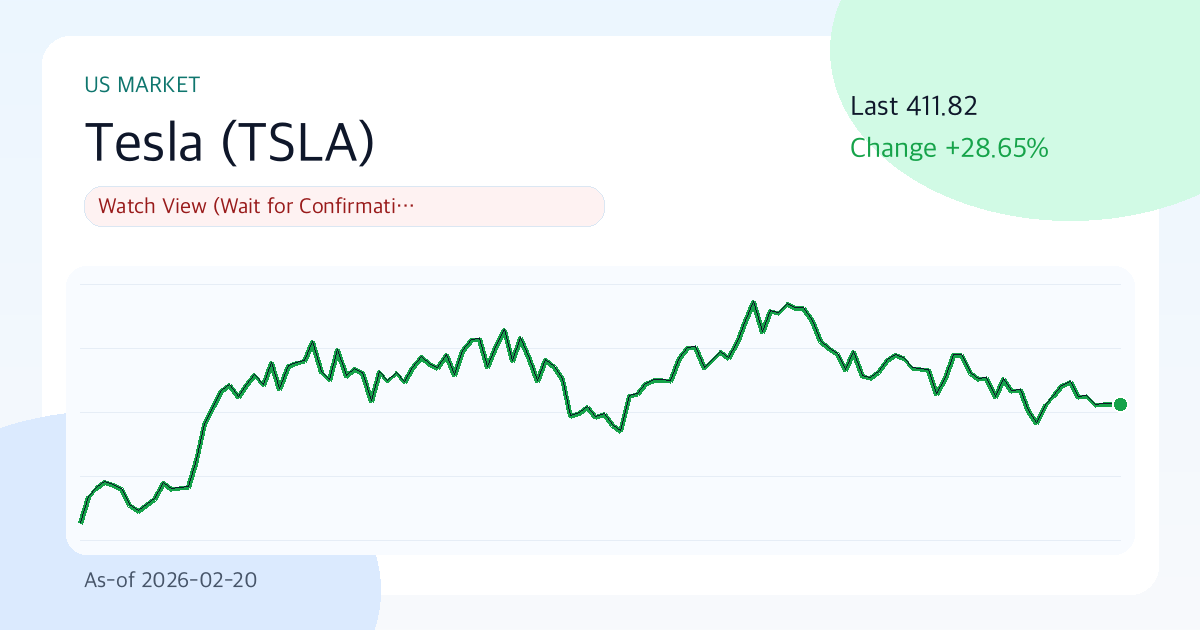
Tesla (TSLA) 411.82 | 3M +1.9% | Vol 33.9% | Risk Management Priority Zone (As of: 2026-02-20)
Summary
- One-line judgment: Wait-and-see approach (Respond after confirmation)
- Confidence level: Moderate
- Comment: Overall score is 44.1 points, with a high weight on risk management (76.0 points). The current price of 411.82 is in a neutral zone between the short-term support level of 397.21 and the resistance level of 449.36. It's a time to focus on 'under what conditions to change the response' rather than direction.
Key Points (3 Lines)
- The key point to watch in this period is whether the price stays above the 20-day moving average (420.12). If it does, short-term supply and demand are likely to be favorable.
- The combination of a 4.7% margin and 4.9% ROE signals that the core business is not weak, but the D/E ratio of 0.18 requires checking interest rate sensitivity as well.
- Based on a dividend yield of 0.0% and an average payout ratio of 0.0%, dividend sustainability is rated 'Moderate'.
Currently, Tesla's chart requires observing the rhythm before the numbers. In this zone, it is wiser to focus on the possibility of judgment changes due to data updates rather than conviction.
Investment Thesis (Value)
In a zone of valuation pressure, even small changes in earnings can cause significant stock price reactions. As long as the quality of Tesla's earnings is maintained and the market's assigned multiple (PER 384.9, PBR 18.8) does not collapse rapidly, the current valuation level can be justified over time.
The core thesis is 'Can the combination of financial strength (4.7% operating margin, 4.9% ROE) and current price momentum (3-month +1.9%) create a re-rating in the next 1-2 quarters?'
- Growth: Revenue growth rate of -3.1% suggests a potential slowdown in growth.
- Profitability: Operating margin of 4.7% and ROE of 4.9% are interpreted as within the normal range or at the lower end.
- Valuation: PER of 384.9 and PBR of 18.8 are classified as overvalued.
- Cash Return: The combination of an average payout ratio of 0.0% and a dividend yield of 0.0% limits shareholder return attractiveness.
Unique Argument of This Report (Basis)
- The primary basis for the current judgment is the supply and demand dynamics created by the recent 3-month return of 1.9% and the price's position relative to the 20-day moving average (420.12).
- Financial strength is assessed by operating margin (4.7%) and ROE (4.9%); if both decline sharply, the investment thesis quality will significantly weaken.
- The valuation axis is PER 384.9 and PBR 18.8, and the core of this report is whether 'this valuation is excessive relative to the -3.1% growth rate'.
Technical Analysis
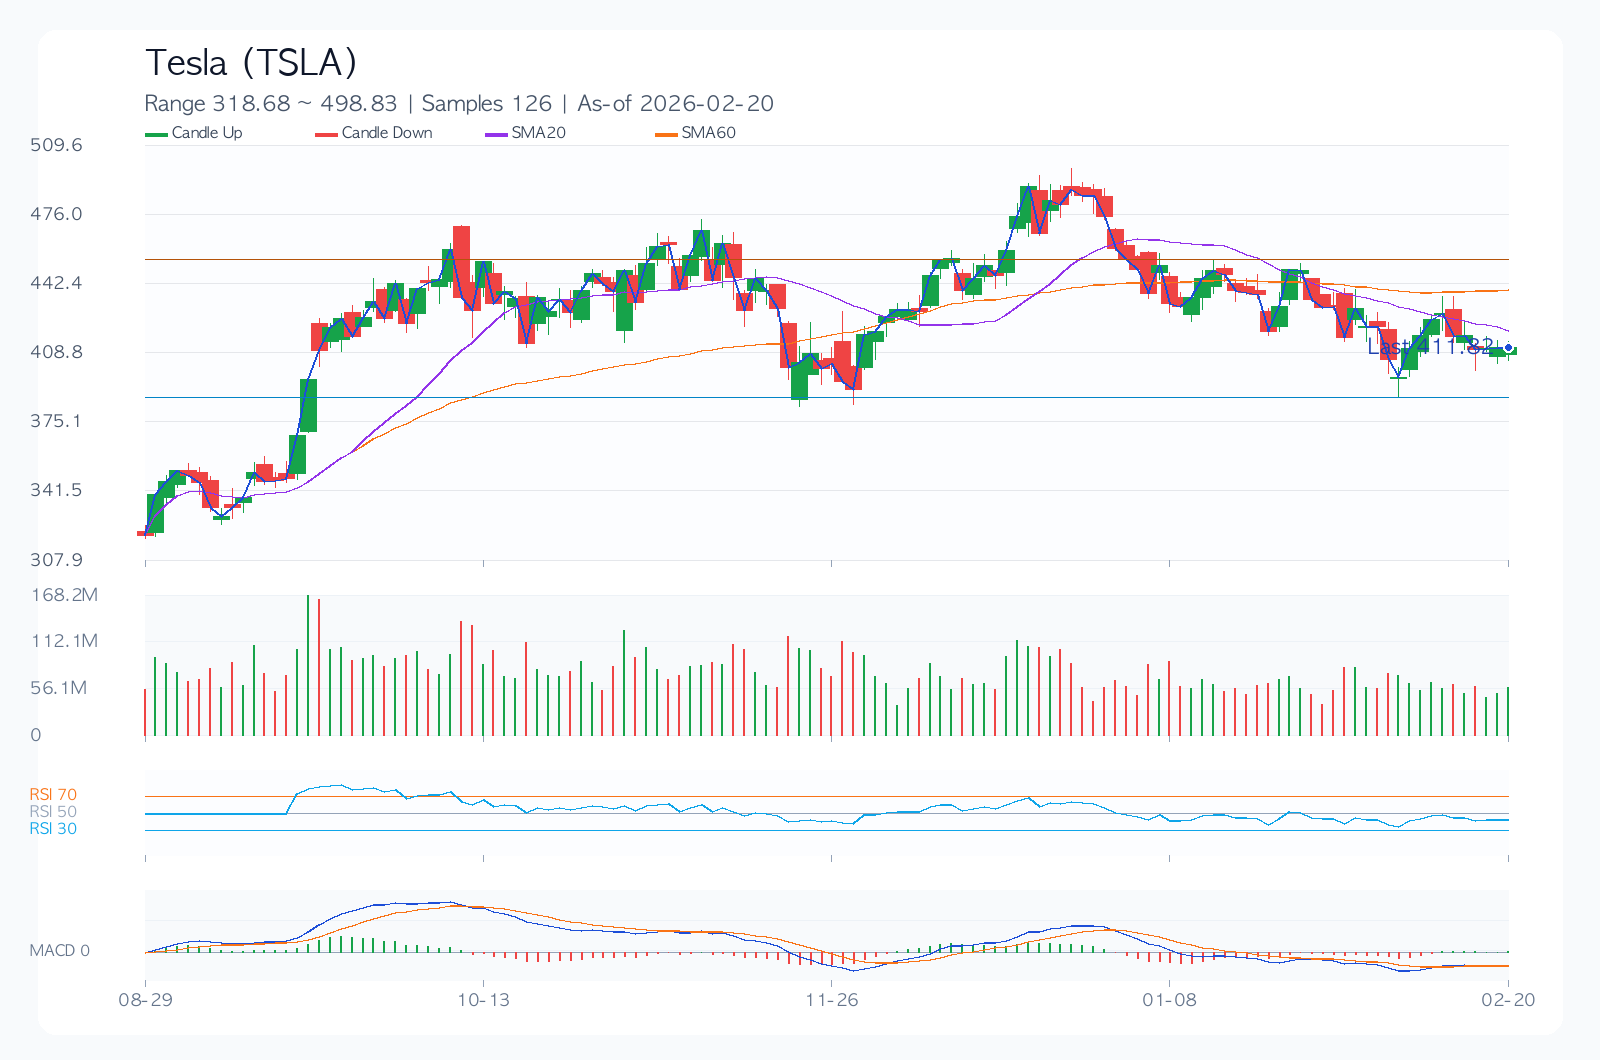
Technically, this is a point where conviction and doubt intersect. Short-term performance is more likely to be determined by managing the support level of 397.21 and the resistance level of 449.36, rather than chasing rallies.
- Trend: The 20-day/60-day/120-day moving averages are 420.12/439.94/429.72, respectively, indicating a mixed or inverse arrangement.
- Momentum: 1-month -8.4%, 3-month 1.9%, 6-month 28.6%, showing mid-term momentum advantage.
- Overbought/Oversold: RSI(14) is 39.0, in the neutral zone.
- Volatility/Drawdown: 30-day annualized volatility of 33.9% and maximum drawdown of -53.8% should be used as benchmarks for position sizing.
- Price Levels: A trend reversal is likely when the short-term support of 397.21 or resistance of 449.36 is broken or breached.
Desk Memo (Light Comment)
While not a dramatic market, traders who adhere to principles in these everyday periods are the ones who build consistent performance.
Key Chart
Financial Statements & Indicators
| Category | Value |
|---|---|
| Overall Score | 44.1/100 |
| Value/Technical/Risk | 34.6 / 38.0 / 76.0 |
| Current Price | 411.82 |
| 1M/3M/6M Return | -8.3% / 1.9% / 28.6% |
| 30-Day Annualized Volatility | 33.9% |
| Max Drawdown (MDD) | -53.8% |
| 52-Week Range | 221.86 ~ 489.88 |
| 20/60/120-Day MA | 420.12 / 439.94 / 429.72 |
| RSI(14) | 39.0 |
| Short-term Support/Resistance | 397.21 / 449.36 |
| Revenue Growth Rate | -3.1% |
| Operating Margin | 4.7% |
| ROE | 4.9% |
| D/E | 0.18 |
| PER / PBR | 384.9 / 18.8 |
| Dividend Yield | 0.0% |
Dividends (History & Sustainability)
The key for dividends is not the yield itself, but whether the policy is maintained even when the economy and earnings fluctuate. Currently rated 'Moderate'.
| Year | DPS | Payout Ratio |
|---|---|---|
| 2022 | 0.00 | 0.0% |
| 2023 | 0.00 | 0.0% |
| 2024 | 0.00 | 0.0% |
| 2025 | 0.00 | 0.0% |
Investor Legend Perspective Simulation
The following simulations do not replicate actual investor trades but are style analyses applying the core questions of each investment philosophy to current data.
| Perspective | Style Score (0-100) | Current Focus | Hypothetical Action Scenario |
|---|---|---|---|
| Warren Buffett (Quality & Margin of Safety) | 0.0 | ROE 4.9%, Operating Margin 4.7%, D/E 0.18, PER 384.9 | Quality is confirmed, but price margin of safety is insufficient; deferral. |
| Peter Lynch (Growth & Price Balance) | 0.0 | Revenue Growth Rate -3.1%, PEG equivalent 384.88, 6-month Return 28.6% | Story exists, but growth appeal relative to price is weak. |
| George Soros (Trend & Speed of Reaction) | 35.5 | 1M/3M Returns -8.3%/1.9%, Volatility 33.9%, RSI 39.0 | Trend reliability is low; wait for confirmation signals, only act on reversal signs. |
Key Risks
Responding to bad scenarios is more important than good ones. For Tesla, risk statements are more like seatbelts to protect a position than warnings. Changes in valuation (PER 384.9, PBR 18.8) and 30-day annualized volatility (33.9%) can determine the speed of downside risk.
- The PER 384.9 zone is a high-valuation re-rating area, so there is significant pressure for multiple contraction upon earnings misses.
- Low operating margins make it difficult to defend profits in the event of rising costs or price competition.
- With a recent maximum drawdown of -53.8%, there is a risk of breaking psychological lows if a downtrend resumes.
- Changes in consensus estimates and guidance comments before and after earnings announcements can influence short-term direction.
- Valuation frameworks can change rapidly due to regulatory, litigation, or policy shifts (trade, antitrust, financial regulations, etc.).
Counterarguments and Invalidating Conditions
The risk is that valuation pressure (PER 384.9, PBR 18.8) combined with slowing demand could lead to a faster multiple adjustment than earnings improvement.
- If the price stays below the short-term support level of 397.21 for more than two weeks, the current trend assumption will be considered invalid.
- If the next quarter's revenue growth rate slows to below 0.0%, the growth assumption needs re-evaluation.
- If the consensus EPS is revised downwards for four consecutive weeks after earnings announcements, the base scenario will be adjusted downwards.
Checklist
Must-See Before Next Announcement/Earnings
- Confirm if revenue growth rate remains above 0.0% in the next quarterly earnings.
- Confirm if the stock price defends the short-term support level of 397.21.
- Confirm if consensus EPS estimates are revised upwards for four consecutive weeks.
Portfolio Management Notes
While volatility itself is not in an overheated zone, movements around events are still significant. This is a time when an approach that sets conditional entry criteria before betting on direction is wise.
Pre-Decision Check
- Have the direction of consensus EPS for the next two quarters (upward/downward) been confirmed?
- Can the financial structure (D/E, interest coverage, cash flow) withstand an economic slowdown?
- Does the entry price secure a risk-reward ratio of at least 1:2 relative to support/resistance zones?
- Are dividend policy (increase/maintain/decrease) and share buyback policies consistently followed?
- Has the maximum acceptable loss been defined in advance in case of a pessimistic scenario?
Conclusion (Optimistic, Base, Pessimistic 3 Scenarios)
| Scenario | Assumption | Key Trigger | Target Price (Model) | Expected Return |
|---|---|---|---|---|
| Optimistic | Simultaneous earnings surprise and multiple defense | Accelerating revenue growth + upward guidance revision | 409.53 | -0.6% |
| Base | Earnings meet consensus, multiple remains neutral | Margin defense + neutral supply/demand | 365.65 | -11.2% |
| Pessimistic | Simultaneous earnings slowdown and multiple contraction | Downward guidance + widening risk premium | 299.83 | -27.2% |
The base scenario target price is 365.65. However, given the wide gap between the optimistic (-0.6%) and pessimistic (-27.2%) scenarios, this is judged to be a period where 'conditional response' is more important than finding the 'correct answer'.
Data Sources
- Data as of:
2026-02-20 - Report generated on:
2026-02-22 - Original Stock Link: https://finance.yahoo.com/quote/TSLA
- Source Data: Yahoo Finance Price/Quote
Related Reports
Recent notes from the same market to compare assumptions.
- JPMorgan Chase(JPM) 289.48 | 3M -8.4% | Vol 26.8% | Risk Management Priority Zone (As of: 2026-03-06) (As-of 2026-03-06)
- Broadcom(AVGO) 330.48 | 3M -13.3% | Vol 37.5% | Entry Timing Check Zone (As of: 2026-03-06) (As-of 2026-03-06)
- Meta Platforms(META) 644.86 | 3M -2.5% | Vol 40.0% | Entry Timing Check Zone (As of: 2026-03-06) (As-of 2026-03-06)
- Exxon Mobil(XOM) 151.21 | 3M +29.1% | Vol 28.3% | Entry Timing Check Zone (As of: 2026-03-06) (As-of 2026-03-06)