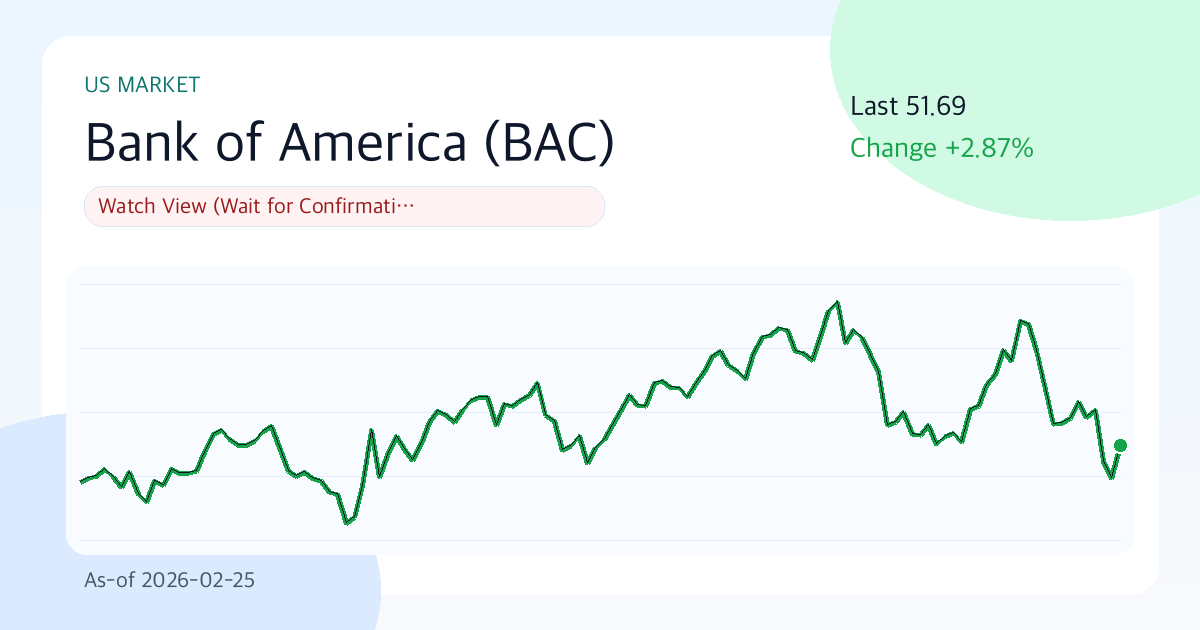
Bank of America(BAC) 51.69 | 3M -0.5% | Vol 26.6% | Risk Management First Zone (As of: 2026-02-25)
Summary
- One-line judgment: Wait-and-see approach (Respond after confirmation)
- Confidence level: High
- Comment: Bank of America (BAC) is currently trading at $51.69, with a short-term support level at $50.41 and a resistance level at $56.53. The 3-month return is -0.5%, indicating a search for direction, and the 30-day annualized volatility is around 26.6%. The overall score is 56.0/100, suggesting that risk management should be prioritized and a cautious approach is warranted in the current range.
Key Points (3 Lines)
- The key point to watch in this range is whether the price stays above the 20-day moving average ($53.46). If it does, short-term supply and demand dynamics are likely to be favorable.
- The combination of a 35.6% margin and 10.2% ROE suggests solid core business strength, but the D/E ratio of 2.71 necessitates checking interest rate sensitivity.
- Considering a dividend yield of 2.18% and an average payout ratio of 28.4%, dividend sustainability is at a 'caution' level.
Looking at Bank of America's chart now, we can glimpse the possibility of a turnaround despite headwinds. Rather than making hasty judgments, it is wise to clearly define 'under what conditions to change our response.'
Investment Thesis (Value)
The core of this range is whether growth and profitability are maintained simultaneously. If Bank of America's earnings quality holds and the market price (PER 13.6, PBR 1.3) does not collapse excessively, the current valuation will gain validity over time.
The key is whether the combination of financial strength (35.6% operating margin, 10.2% ROE) and current price momentum (-0.5% 3-month return) can lead to a re-rating within the next 1-2 quarters.
- Growth: A revenue growth rate of 13.2% suggests a phase of top-line expansion.
- Profitability: An operating margin of 35.6% and ROE of 10.2% are interpreted as within the normal range or at the lower end.
- Valuation: PER of 13.6 and PBR of 1.3 are classified as neutral to reasonable.
- Capital Return: The combination of an average payout ratio of 28.4% and a dividend yield of 2.18% is positive for shareholder return attractiveness.
Unique Argument of This Report (Basis)
- The primary basis for the current judgment is the supply and demand dynamics created by the recent 3-month return of -0.5% and the price's position relative to the 20-day moving average ($53.46).
- Financial strength is assessed by an operating margin of 35.6% and ROE of 10.2%; if both indicators decline simultaneously, the basis of the investment thesis weakens.
- The valuation metrics are PER 13.6 and PBR 1.3, and the key question is 'Is this valuation excessive compared to the 13.2% growth rate?'
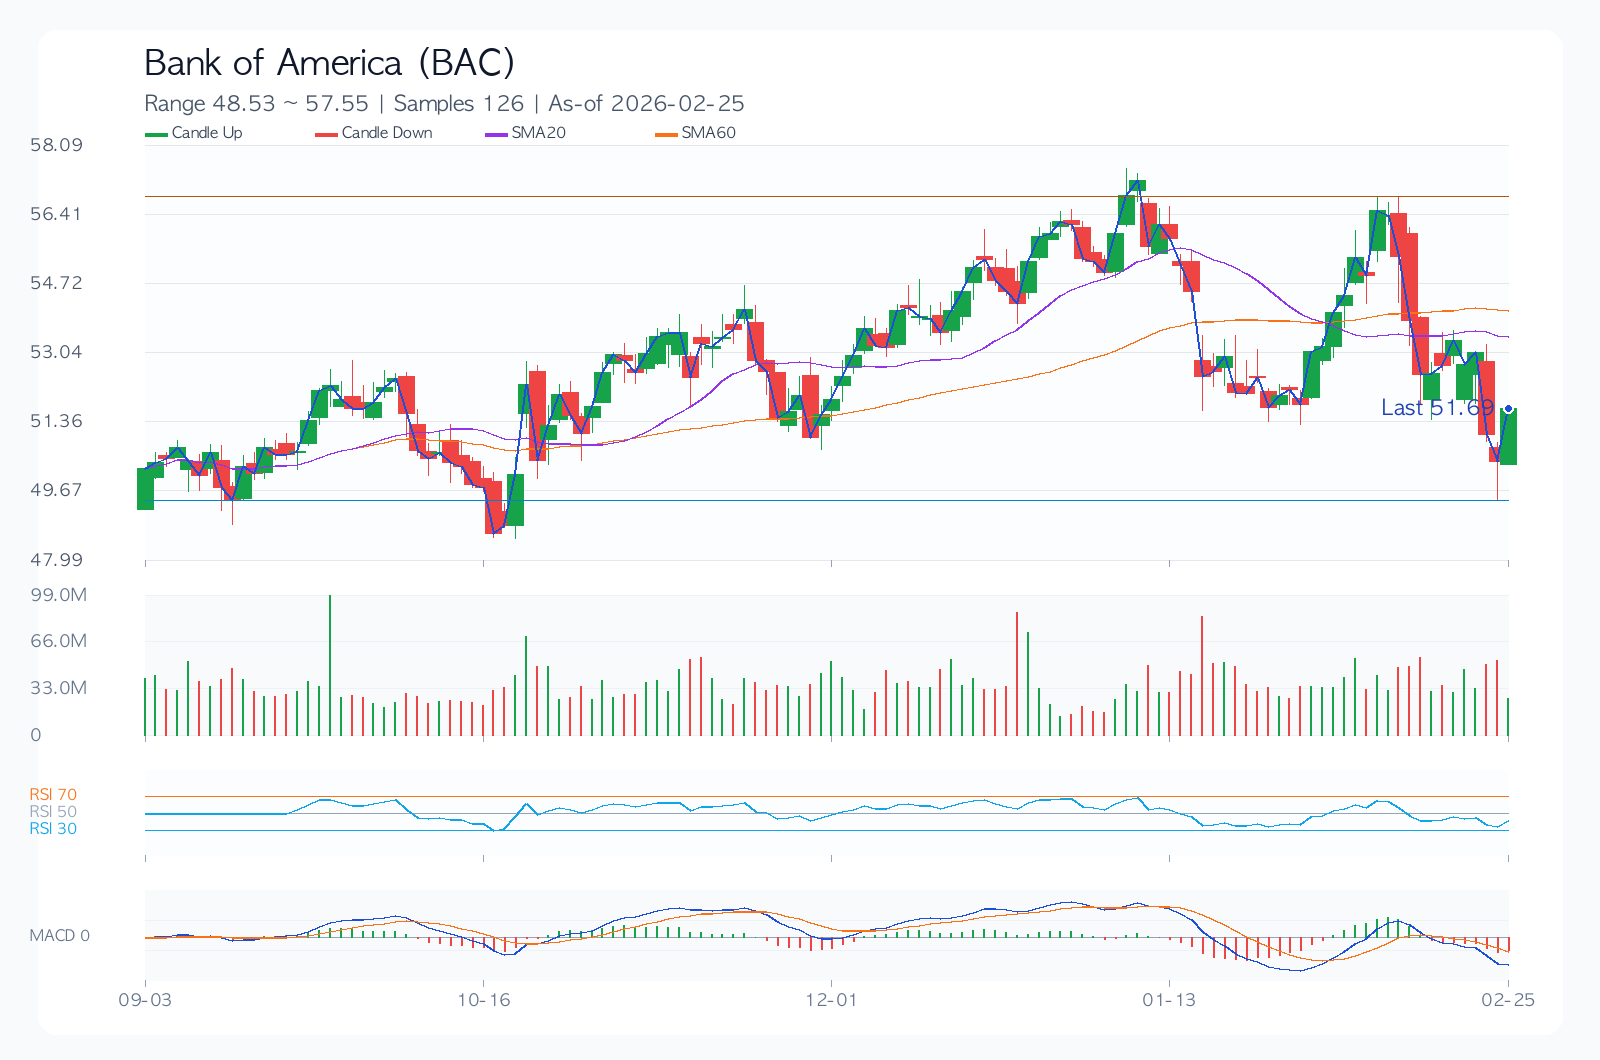
Technical Analysis
Technically, this is a point where conviction and doubt intersect. Therefore, level management is more likely to determine performance than chasing the rally. Pay close attention to the short-term support level of $50.41 and the resistance level of $56.53.
- Trend: The 20-day/60-day/120-day moving averages ($53.46/$54.08/$52.85) are mixed or in a bearish arrangement.
- Momentum: 1-month -0.9%, 3-month -0.5%, 6-month 2.9%, indicating high directional uncertainty.
- Overbought/Oversold: RSI(14) is at 34.2, positioned in the neutral zone.
- Volatility/Drawdown: 30-day annualized volatility of 26.6% and maximum drawdown of -28.0% should be used as benchmarks for position sizing.
- Price Levels: A trend reversal is possible when the short-term support of $50.41 or resistance of $56.53 is broken or breached.
Desk Memo (Light Comment)
While not a dramatic market, adhering to principles in these everyday situations leads to consistent performance.
Key Chart
Financial Statements/Indicators
| Category | Value |
|---|---|
| Overall Score | 56.0/100 |
| Value/Technical/Risk | 56.0 / 38.3 / 87.0 |
| Current Price | 51.69 |
| 1M/3M/6M Return | -0.9% / -0.5% / 2.9% |
| 30-Day Annualized Volatility | 26.6% |
| Max Drawdown (MDD) | -28.0% |
| 52-Week Range | 34.39 ~ 57.25 |
| 20/60/120 Day MA | 53.46 / 54.08 / 52.85 |
| RSI(14) | 34.2 |
| Short-Term Support/Resistance | 50.41 / 56.53 |
| Revenue Growth Rate | 13.2% |
| Operating Margin | 35.6% |
| ROE | 10.2% |
| D/E | 2.71 |
| PER / PBR | 13.6 / 1.3 |
| Dividend Yield | 2.2% |
Dividends (History/Sustainability)
More important than the dividend yield (2.18%) itself is whether the policy is maintained when the economy falters. Current dividend sustainability is assessed as 'caution' level.
| Year | DPS | Payout Ratio |
|---|---|---|
| 2022 | 0.86 | 28.4% |
| 2023 | 0.92 | 28.4% |
| 2024 | 1.00 | 28.4% |
| 2025 | 1.08 | 28.4% |
Investor Perspectives Simulation
This simulation does not replicate actual expert trading but applies the core questions of each investment philosophy to the current data.
| Perspective | Style Score (0-100) | Current Focus | Hypothetical Action Scenario |
|---|---|---|---|
| Warren Buffett Perspective (Quality/Margin of Safety) | 24.1 | ROE 10.2%, Operating Margin 35.6%, D/E 2.71, PER 13.6 | Quality is confirmed, but the margin of safety in price is deemed insufficient; therefore, hold. |
| Peter Lynch Perspective (Growth/Price Balance) | 66.4 | Revenue Growth Rate 13.2%, PEG Ratio ~1.03, 6-month Return 2.9% | Small tracking position until the sustainability of the growth rate is confirmed. |
| George Soros Perspective (Trend/Speed of Reaction) | 42.6 | 1M/3M Return -0.9%/-0.5%, Volatility 26.6%, RSI 34.2 | Low trend reliability; wait for signal confirmation, only act on reversal signs. |
Key Risks
Preparing for the worst-case scenario is more important than the best-case scenario. For Bank of America, changes in the current valuation metrics (PER 13.6, PBR 1.3) and 30-day annualized volatility (26.6%) will be key variables determining the speed of downside risk.
- High financial leverage (D/E 2.71) makes it vulnerable to rising interest rates or increased refinancing costs.
- Changes in consensus estimates and guidance comments before and after earnings announcements can significantly influence short-term direction.
- Regulatory, litigation, or policy changes (trade, antitrust, financial regulations, etc.) can drastically alter the valuation framework.
- There is a risk of weakening market share and profit margin defense due to changes in the competitive intensity of core businesses.
Counterarguments and Invalidation Conditions
The counterargument is that 'if valuation burden (PER 13.6, PBR 1.3) or demand slowdown is confirmed, the speed of multiple contraction may outpace the speed of earnings improvement.'
- If the price remains below the short-term support level of $50.41 for more than two weeks, the current trend assumption will be considered invalidated.
- If the next quarter's revenue growth rate slows to below 10.2%, the growth assumption needs to be re-examined.
- If the consensus EPS is revised downwards for four consecutive weeks after the earnings announcement, the base case scenario will be lowered.
Checklist
Must-See Before Next Announcement/Earnings
- Confirm that the revenue growth rate is maintained at 11.2% or higher in the next quarterly earnings.
- Confirm whether the stock price successfully defends the short-term support level of $50.41.
- Observe whether the consensus EPS estimates are revised upwards for four consecutive weeks.
Portfolio Management Notes
While not in an overheated volatility phase, fluctuations around events remain significant. Given the neutral market conditions, it is more rational to establish conditional entry criteria rather than betting on direction.
Pre-Decision Checks
- Have the consensus EPS estimates for the next two quarters (upward/downward trend) been confirmed?
- Can the financial structure (D/E, interest coverage, cash flow) withstand an economic slowdown?
- Does the entry price secure a risk-reward ratio of at least 1:2 relative to support/resistance levels?
- Are dividend policy (increase/maintain/decrease) and share buyback policy consistent?
- Has the maximum acceptable loss in the event of a pessimistic scenario been defined in advance?
Conclusion (Optimistic, Base, Pessimistic 3 Scenarios)
| Scenario | Assumption | Key Trigger | Target Price (Model) | Expected Return |
|---|---|---|---|---|
| Optimistic | Earnings surprise and valuation multiple defense occur simultaneously | Accelerating revenue growth + upward guidance | 56.42 | 9.2% |
| Base | Earnings meet consensus, and valuation multiples remain neutral | Margin defense + neutral supply/demand | 50.37 | -2.5% |
| Pessimistic | Earnings slowdown and valuation multiple contraction occur simultaneously | Downward guidance + widening risk premium | 41.31 | -20.1% |
The base scenario target price is $50.37. However, given the wide gap between the optimistic scenario (9.2% upside) and the pessimistic scenario (-20.1% downside), this stock is in a phase where focusing on 'conditional response' is more appropriate than searching for the 'correct answer.'
Verification of Previous Report's Forecast
- Previous Report: 20260220-us-bac
- Previous Judgment: Neutral approach (Phased entry)
- Previous Base Scenario Expected Return: -1.6%
- Realized Return Based on Current Data: -2.6%
- Evaluation: Generally consistent
Data Sources
- Data As Of:
2026-02-25 - Report Generation Date:
2026-02-25 - Original Stock Link: https://finance.yahoo.com/quote/BAC
- Source Data: Yahoo Finance Price/Quote
Related Reports
Recent notes from the same market to compare assumptions.
- JPMorgan Chase(JPM) 289.48 | 3M -8.4% | Vol 26.8% | Risk Management Priority Zone (As of: 2026-03-06) (As-of 2026-03-06)
- Broadcom(AVGO) 330.48 | 3M -13.3% | Vol 37.5% | Entry Timing Check Zone (As of: 2026-03-06) (As-of 2026-03-06)
- Meta Platforms(META) 644.86 | 3M -2.5% | Vol 40.0% | Entry Timing Check Zone (As of: 2026-03-06) (As-of 2026-03-06)
- Exxon Mobil(XOM) 151.21 | 3M +29.1% | Vol 28.3% | Entry Timing Check Zone (As of: 2026-03-06) (As-of 2026-03-06)