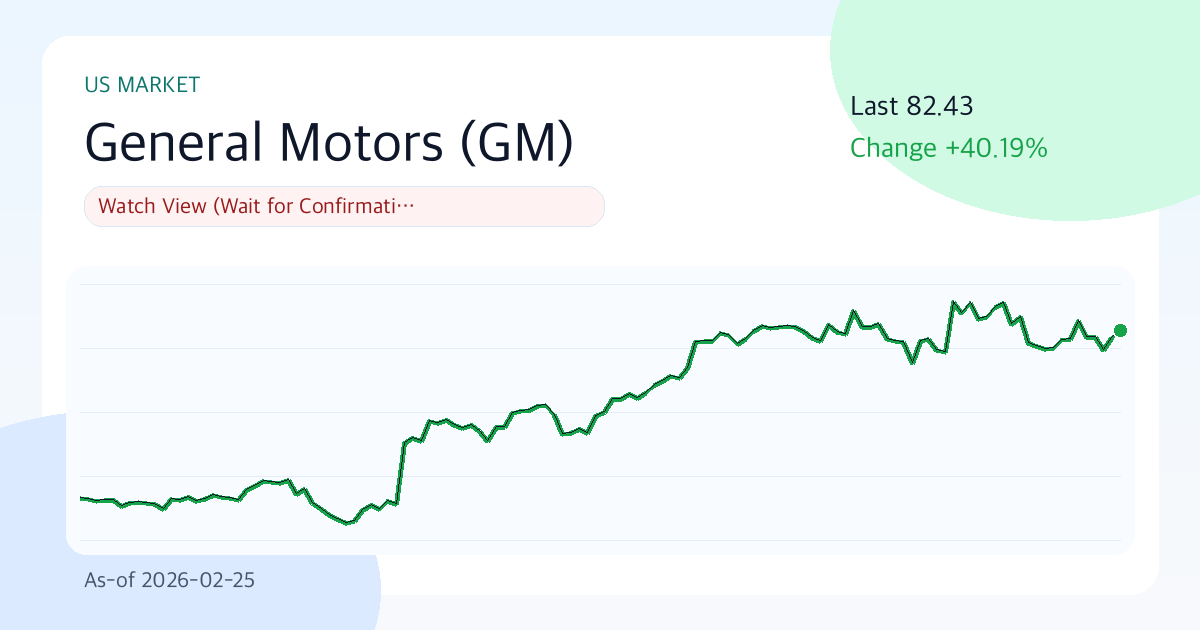
General Motors (GM) $82.43 | 3-Month 16.1% Up | Volatility 40.3% | A Period Prioritizing Risk Management (As of: 2026-02-25)
Summary
- One-Line Verdict: Wait-and-See Approach (Confirm Before Acting)
- Confidence Level: Moderate
- Comment: General Motors (GM) currently scores 51.0 (Valuation 38.0, Technical 50.5, Risk 81.0). The price of $82.43 is positioned between the short-term support at $77.81 and resistance at $86.38, with a 30-day annualized volatility of 40.3%. The current period is neutral, and confidence hinges on data updates. Establishing criteria for 'when to change the judgment' is more crucial than making hasty decisions.
Key Points (3 Lines)
- The main point to watch in this period is whether the price can maintain above the 20-day moving average ($82.60). If it does, short-term supply and demand are likely to be favorable.
- The combination of a 6.5% operating profit margin and 4.3% ROE signals decent core business strength, but the high debt-to-equity ratio (2.15) necessitates monitoring interest rate sensitivity.
- Considering a dividend yield of 0.9% and an average payout ratio of 17.4%, dividend sustainability is at a 'Caution' level.
Looking at General Motors' chart, the rhythm beyond the numbers catches the eye first. This is a neutral period, and confidence depends on data updates, making it wise to first establish 'when to change the judgment' rather than rushing to conclusions.
Investment Thesis (Valuation)
Finding the balance between the quality of earnings and price is important. If General Motors' earnings quality is maintained and the market's valuation (PER 25.2x, PBR 1.2x) does not fall excessively, the current valuation can gain justification over time.
The key question is whether the combination of financial strength (6.5% operating margin, 4.3% ROE) and current price momentum (16.1% increase over 3 months) can lead to a re-rating in the next 1-2 quarters.
- Growth: A -5.1% revenue growth rate suggests potential for slowing growth.
- Profitability: A 6.5% operating margin and 4.3% ROE are interpreted as being at the lower end of the normal range.
- Valuation: A PER of 25.2x and PBR of 1.2x are classified as neutral to reasonable.
- Capital Returns: The combination of an average payout ratio of 17.4% and a dividend yield of 0.9% offers limited shareholder return attractiveness.
Unique Arguments of This Report (Rationale)
- The most important basis for the current judgment is the supply and demand dynamics created by the recent 16.1% return over three months and the price's position above/below the 20-day moving average ($82.60).
- Financial strength is assessed by the 6.5% operating margin and 4.3% ROE; if both indicators decline simultaneously, the investment thesis will weaken significantly.
- The valuation stands at a PER of 25.2x and PBR of 1.2x; the core of this analysis is whether this valuation is excessive relative to the -5.1% growth rate.
Technical Analysis
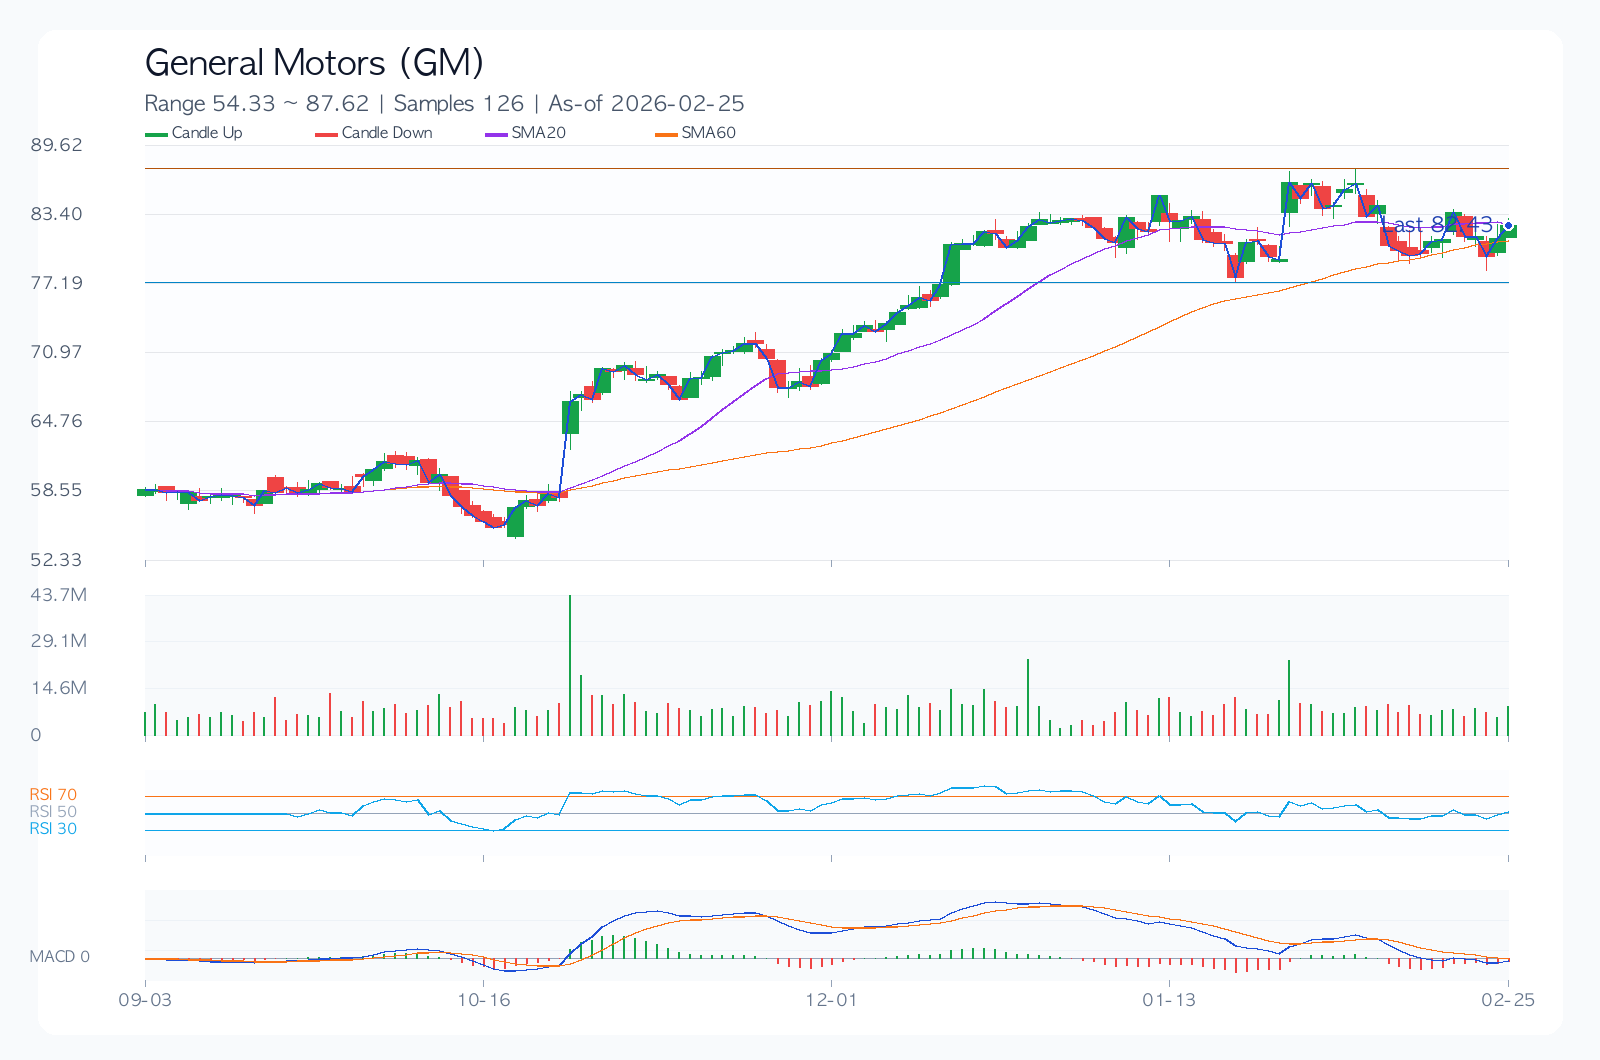
Technically, this is a point where conviction and doubt intersect. Therefore, focusing on level management (Support $77.81 / Resistance $86.38) rather than chasing the rally is more likely to determine performance.
- Trend: The 20-day, 60-day, and 120-day moving averages are $82.60, $81.17, and $72.31, respectively, maintaining an upward (golden) cross formation.
- Momentum: 1-month (-4.6%), 3-month (16.1%), and 6-month (40.2%) indicate mid-term momentum is dominant.
- Overbought/Oversold: The RSI (14) indicator is at 39.9, positioned in the neutral zone.
- Volatility/Drawdown: 30-day annualized volatility of 40.3% and a maximum drawdown of -29.4% should be used as benchmarks for position sizing.
- Price Levels: A trend reversal is likely when the price breaks below the short-term support at $77.81 or above the resistance at $86.38.
Desk Memo (Light Commentary)
On days like today, stop-loss rules are more important than coffee. Given the high volatility, simply reducing position size can significantly manage return fluctuations.
Key Chart
Financial Statements & Indicators
| Category | Value |
|---|---|
| Overall Score | 51.0/100 |
| Valuation/Technical/Risk | 38.0 / 50.5 / 81.0 |
| Current Price | 82.43 |
| 1M/3M/6M Return | -4.6% / 16.1% / 40.2% |
| 30-Day Annualized Volatility | 40.3% |
| Max Drawdown (MDD) | -29.4% |
| 52-Week Range | 42.48 ~ 86.38 |
| 20/60/120-Day MA | 82.60 / 81.17 / 72.31 |
| RSI(14) | 39.9 |
| Short-Term Support/Resistance | 77.81 / 86.38 |
| Revenue Growth Rate | -5.1% |
| Operating Profit Margin | 6.5% |
| ROE | 4.3% |
| D/E | 2.15 |
| PER / PBR | 25.2 / 1.2 |
| Dividend Yield | 0.9% |
Dividends (History & Sustainability)
More important than the dividend yield itself is whether the policy is maintained during economic and earnings fluctuations. Currently, General Motors' dividend sustainability is at a 'Caution' level.
| Year | DPS | Payout Ratio |
|---|---|---|
| 2022 | 0.18 | 17.4% |
| 2023 | 0.36 | 17.4% |
| 2024 | 0.48 | 17.4% |
| 2025 | 0.57 | 17.4% |
Investor Philosophy Simulation
The following content is not a reproduction of actual investor trades but a style simulation applying the core questions of each investment philosophy to current data.
| Perspective | Style Score (0-100) | Current Focus | Hypothetical Action Scenario |
|---|---|---|---|
| Warren Buffett (Quality/Margin of Safety) | 0.0 | ROE 4.3%, Operating Margin 6.5%, D/E 2.15, PER 25.2 | Quality is noted, but insufficient price margin of safety; holding off. |
| Peter Lynch (Growth/Price Balance) | 0.0 | Revenue Growth -5.1%, PEG Ratio ~25.21, 6-Month Return 40.2% | Story exists, but growth appeal relative to price is weak. |
| George Soros (Trend/Pace of Reaction) | 49.0 | 1M/3M Returns -4.6%/16.1%, Volatility 40.3%, RSI 39.9 | Trend reliability is low; waiting for signal confirmation, acting only on signs of reversal. |
Key Risks
Responding to bad scenarios is more important than focusing on good ones. For General Motors, the current risk is closer to a safety net for maintaining a position rather than a warning. In the current period, changes in valuation (PER 25.2x, PBR 1.2x) and 30-day annualized volatility (40.3%) can determine the speed of downside risk.
- The high debt-to-equity ratio (2.15) could expose financial vulnerabilities during interest rate hikes or increased refinancing costs.
- A 40.3% annualized volatility level implies potential for sharp movements during events, making clear stop-loss rules essential.
- The relatively low operating margin could make it difficult to defend profits against rising costs or increased price competition.
- Changes in consensus estimates and management guidance comments before/after earnings announcements can significantly influence short-term stock direction.
- Regulatory, litigation, or policy changes (trade, antitrust, financial regulations, etc.) are potential factors that could drastically alter the valuation framework.
Counterarguments and Invalidation Conditions
Conversely, the counterargument is that valuation pressure (PER 25.2x, PBR 1.2x) could become prominent, or demand slowdown could be confirmed, leading to a faster multiple contraction than earnings improvement.
- If the price remains below the short-term support level of $77.81 for more than two weeks, the current trend assumption will be considered invalidated.
- If the next quarter's revenue growth rate slows to below 0.0%, a reassessment of the growth assumption will be necessary.
- If consensus EPS is revised downward for four consecutive weeks after an earnings announcement, the base scenario will be lowered.
Checklist
Must-See Items Before Next Disclosure/Earnings
- Confirm if revenue growth rate remains above 0.0% in the next quarterly earnings announcement.
- Monitor whether the stock price successfully defends the short-term support level of $77.81.
- Check if the consensus EPS estimates show an upward trend for four consecutive weeks.
Portfolio Management Notes
Given the high volatility, concentrated investment in a single stock is not recommended. As this is a neutral period, an approach that prioritizes establishing conditional entry criteria over betting on direction is reasonable.
Pre-Decision Checks
- Have the EPS consensus trends for the next two quarters (upward/downward) been confirmed?
- Can the current financial structure (D/E, interest coverage ratio, cash flow) withstand an economic slowdown?
- Does the entry price secure a risk-reward ratio of at least 1:2 relative to support/resistance levels?
- Are dividend policies (increase/maintain/decrease) and share buyback policies consistently maintained?
- Has the maximum acceptable loss in the event of a pessimistic scenario been pre-defined?
Conclusion (Optimistic, Base, Pessimistic 3 Scenarios)
| Scenario | Assumption | Key Trigger | Target Price (Model) | Expected Return |
|---|---|---|---|---|
| Optimistic | Scenario of simultaneous earnings surprise and multiple defense | Accelerating revenue growth and upward guidance revision | 85.57 | 3.8% |
| Base | Scenario where earnings meet consensus and multiples remain at current levels | Successful margin defense and supply/demand stabilization | 76.40 | -7.3% |
| Pessimistic | Scenario of simultaneous earnings slowdown and multiple contraction | Downward guidance and widening risk premium | 62.65 | -24.0% |
The target price for the base scenario is $76.40. However, given the wide gap between the optimistic (3.8%) and pessimistic (-24.0%) scenarios, focusing on 'conditional response' rather than finding the 'correct answer' for this stock is appropriate.
Data Sources
- Data As of:
2026-02-25 - Report Generated On:
2026-02-25 - Original Stock Link: https://finance.yahoo.com/quote/GM
- Source Data: Yahoo Finance Price/Quote
Related Reports
Recent notes from the same market to compare assumptions.
- JPMorgan Chase(JPM) 289.48 | 3M -8.4% | Vol 26.8% | Risk Management Priority Zone (As of: 2026-03-06) (As-of 2026-03-06)
- Broadcom(AVGO) 330.48 | 3M -13.3% | Vol 37.5% | Entry Timing Check Zone (As of: 2026-03-06) (As-of 2026-03-06)
- Meta Platforms(META) 644.86 | 3M -2.5% | Vol 40.0% | Entry Timing Check Zone (As of: 2026-03-06) (As-of 2026-03-06)
- Exxon Mobil(XOM) 151.21 | 3M +29.1% | Vol 28.3% | Entry Timing Check Zone (As of: 2026-03-06) (As-of 2026-03-06)