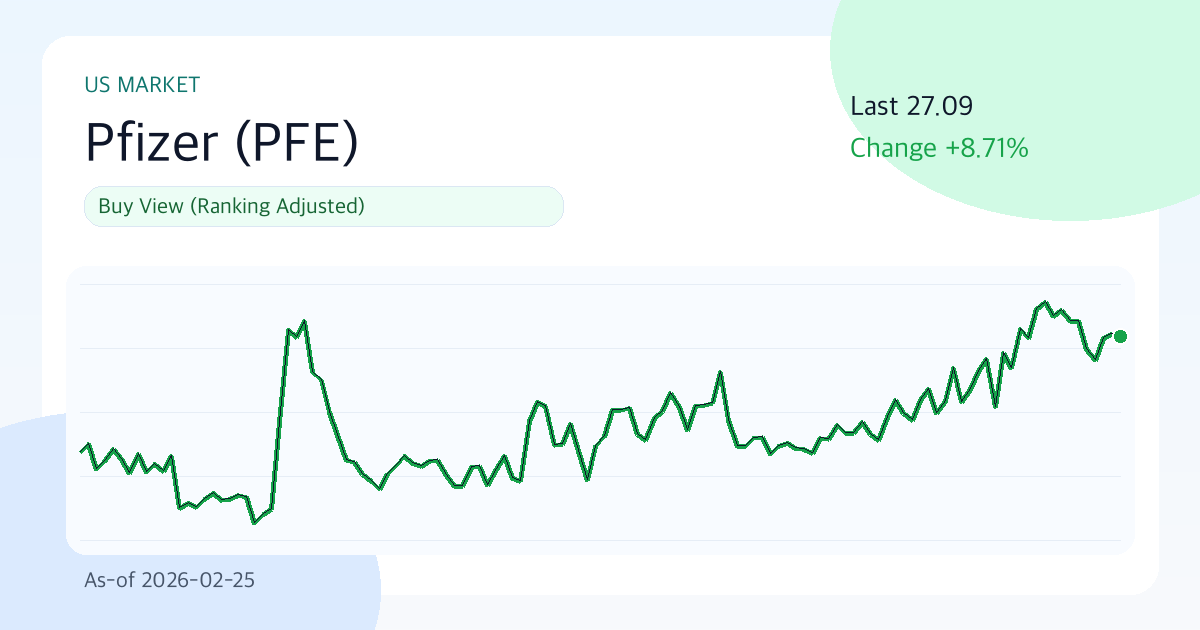
Pfizer (PFE) $27.09 | 3-Month 7.4% Rise | 24.9% Volatility | Entry Timing Check Zone (As of: 2026-02-25)
Summary
- One-Line Judgment: Buy View (Rank Adjusted)
- Confidence Level: High
- Comment: Pfizer (PFE) is currently trading at $27.09, having risen 7.4% over the past three months, with a 30-day annualized volatility of 24.9%. The overall score is 69.9, with a perfect 100 in risk management. The current phase is adjusted to a buy view; clarifying 'buy conditions' is more important than chasing the price.
Key Points (3 Lines)
- The main point to watch in this phase is whether the price stays above the 20-day moving average ($26.91). If it does, short-term supply and demand are likely to be favorable.
- The combination of a 24.6% margin and 8.6% ROE signals that the core business is not weak, but the 0.67 D/E ratio requires checking interest rate sensitivity.
- Based on a 6.3% dividend yield and an average payout ratio of 1.3%, dividend sustainability is assessed as 'Good'.
Pfizer's (PFE) current stock price trend calls for caution against premature judgments. Confidence comes from data updates, so it's wise to first determine 'under what conditions the judgment will change.'
Investment Thesis (Value)
Finding the balance between the quality of earnings and price is crucial. If Pfizer's earnings quality is maintained and the market-assigned price (PER 19.9, PBR 1.7) does not collapse rapidly, the current valuation will gain justification over time.
The core thesis is whether the combination of 'financial strength (24.6% operating margin, 8.6% ROE)' and 'current price momentum (7.4% over 3 months)' can create a re-rating in the next 1-2 quarters.
- Growth: A -1.2% revenue growth rate suggests potential for slowing growth.
- Profitability: A 24.6% operating margin and 8.6% ROE are interpreted as within the normal range or at the lower end.
- Valuation: PER 19.9 and PBR 1.7 are classified as neutral to reasonable.
- Capital Return: The combination of a 1.3% average payout ratio and a 6.3% dividend yield positively impacts shareholder return attractiveness.
Unique Argument of This Report (Rationale)
- The primary basis for the current judgment is the supply and demand dynamics created by the recent 3-month return of 7.4% and the price's position relative to the 20-day moving average ($26.91).
- Financial strength is assessed by the 24.6% operating margin and 8.6% ROE; if both indicators decline sharply, the investment thesis quality will significantly weaken.
- The valuation metrics are PER 19.9 and PBR 1.7; the core of this report is whether 'this valuation is excessive relative to the -1.2% growth rate.'
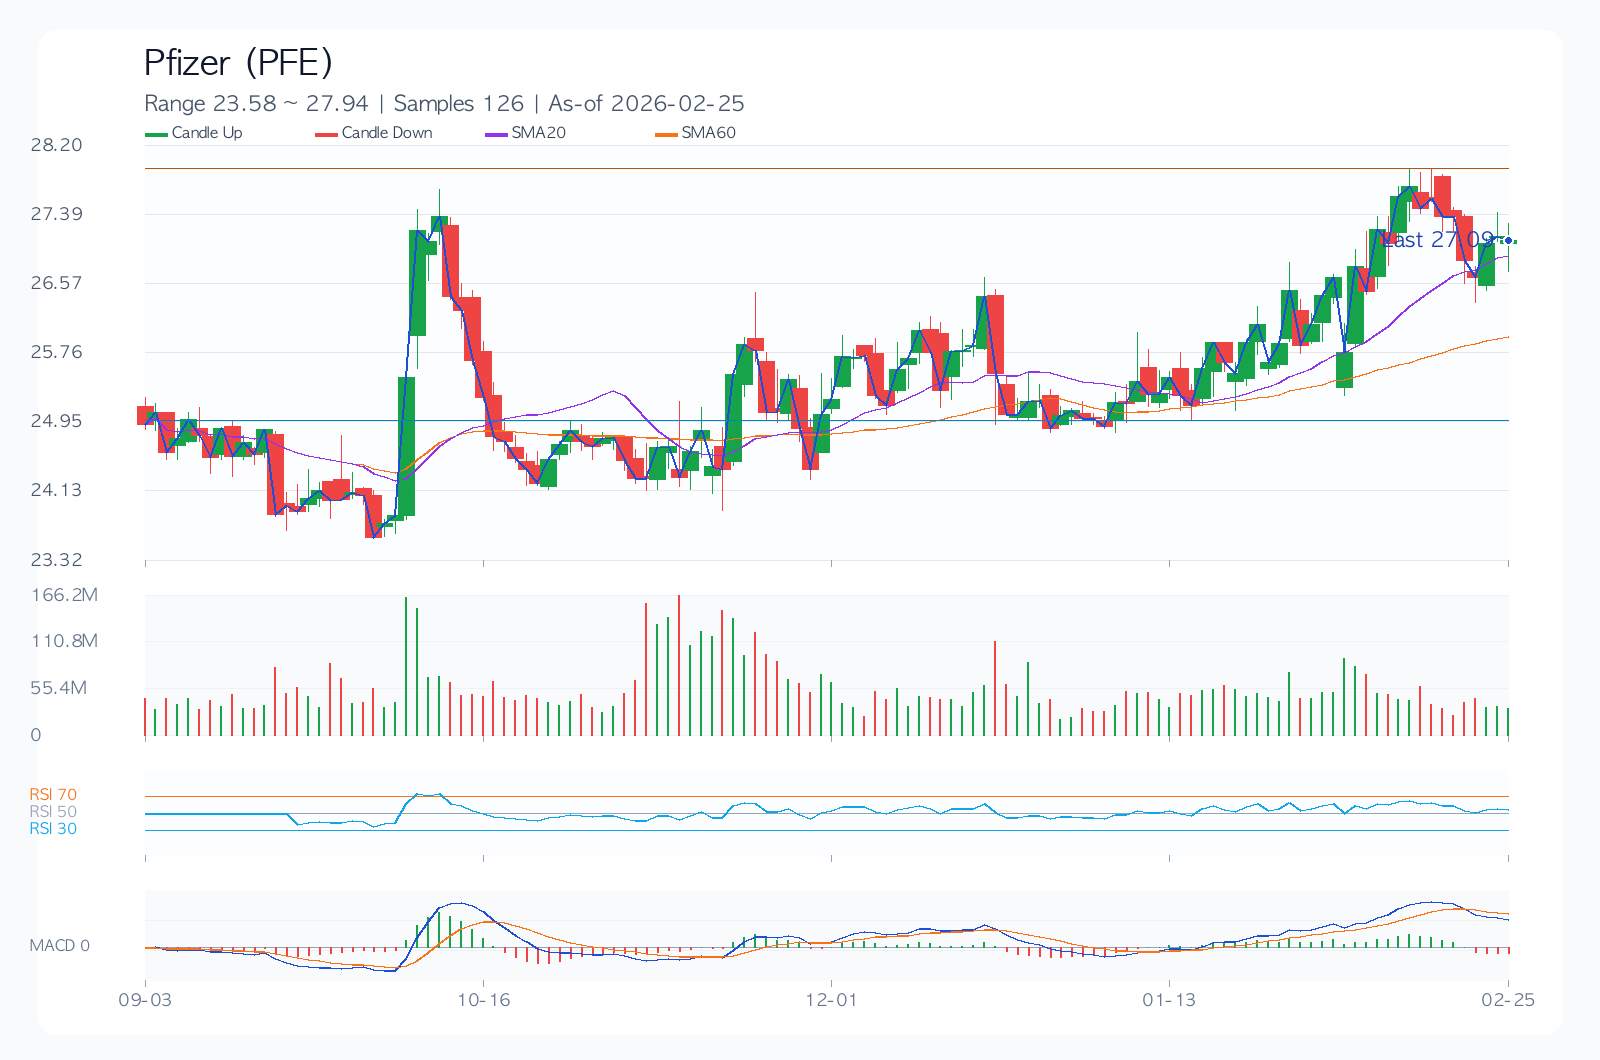
Technical Analysis
Technically, this is a juncture where conviction and doubt coexist. Therefore, position management focused on level monitoring, specifically considering the support at $25.15 and resistance at $27.73, is likely to determine performance, rather than chasing the price.
- Trend: The 20-day, 60-day, and 120-day moving averages are $26.91, $25.96, and $25.40, respectively, in a positive alignment.
- Momentum: 1-month 2.2%, 3-month 7.4%, 6-month 8.7%, indicating mid-term momentum is dominant.
- Overbought/Oversold: RSI(14) is at 54.2, positioned in the neutral zone.
- Volatility/Drawdown: 30-day annualized volatility of 24.9% and a maximum drawdown of -31.2% should be used as benchmarks for position sizing.
- Price Levels: Trend reversal is likely when the short-term support at $25.15 or resistance at $27.73 is broken.
Desk Memo (Light Comment)
While there are no dramatic movements, trading according to rules in these everyday phases can actually lead to consistent performance.
Key Chart
Financial Statements & Indicators
| Metric | Value |
|---|---|
| Overall Score | 69.9/100 |
| Value/Technical/Risk | 58.6 / 67.3 / 100.0 |
| Current Price | $27.09 |
| 1M/3M/6M Return | 2.2% / 7.4% / 8.7% |
| 30-Day Annualized Volatility | 24.9% |
| Max Drawdown (MDD) | -31.2% |
| 52-Week Range | $21.59 ~ $27.73 |
| 20/60/120 Day MA | $26.91 / $25.96 / $25.40 |
| RSI(14) | 54.2 |
| Short-Term Support/Resistance | $25.15 / $27.73 |
| Revenue Growth Rate | -1.2% |
| Operating Margin | 24.6% |
| ROE | 8.6% |
| D/E Ratio | 0.67 |
| PER / PBR | 19.9 / 1.7 |
| Dividend Yield | 6.3% |
Dividends (History & Sustainability)
More important than the yield itself is whether the policy is maintained even when the economy and earnings fluctuate. Pfizer's dividend sustainability is rated 'Good'.
| Year | DPS | Payout Ratio |
|---|---|---|
| 2022 | $1.60 | 1.3% |
| 2023 | $1.64 | 1.3% |
| 2024 | $1.68 | 1.3% |
| 2025 | $1.72 | 1.3% |
Investment Guru Perspective Simulation
The following scenarios are not reproductions of actual investment strategies but style simulations applying the core questions of each investment philosophy to current data.
| Perspective | Style Score (0-100) | Current Focus | Hypothetical Action Scenario |
|---|---|---|---|
| Warren Buffett (Quality & Margin of Safety) | 49.7 | ROE 8.6%, Operating Margin 24.6%, D/E 0.67, PER 19.9 | Quality confirmed, but insufficient price margin of safety; hold. |
| Peter Lynch (Growth & Price Balance) | 0.0 | Revenue Growth Rate -1.2%, PEG-like ratio 19.92, 6-Month Return 8.7% | Story exists, but growth appeal relative to price is weak. |
| George Soros (Trend & Reactivity) | 64.0 | 1M/3M Return 2.2%/7.4%, Volatility 24.9%, RSI 54.2 | Focus on event-driven responses rather than direction; set stop-loss criteria first. |
Key Risks
Responding to bad scenarios is more important than good ones. For Pfizer, current risk management is akin to a safety net for maintaining positions. Changes in valuation metrics (PER 19.9, PBR 1.7) and 30-day annualized volatility (24.9%) could determine the speed of downside risk.
- The recent maximum drawdown of -31.2% suggests a risk of breaking psychological lows if a downtrend resumes.
- Changes in consensus estimates and guidance comments before/after earnings announcements can significantly influence short-term direction.
- Valuation frameworks can change rapidly due to regulations, lawsuits, or policy shifts (trade, antitrust, financial regulations, etc.).
- Increased competition in core businesses could weaken market share and profit margin defense.
Counterarguments and Invalidation Conditions
The counterargument is that 'valuation burden (PER 19.9, PBR 1.7) or slowing demand could lead to multiple compression faster than earnings improvement.'
- If the price stays below the short-term support level of $25.15 for more than two weeks, the current trend assumption will be considered invalid.
- If the next quarter's revenue growth rate slows to below 0.0%, the growth assumption needs re-evaluation.
- If consensus EPS is revised downward for four consecutive weeks after an earnings announcement, the base scenario will be lowered.
Checklist
Must-Watch Before Next Announcement/Earnings
- Confirm if revenue growth rate remains at or above 0.0% in the next quarterly earnings.
- Monitor whether the stock price successfully defends the short-term support level of $25.15.
- Continuously check if consensus EPS estimates are revised upward for four consecutive weeks.
Portfolio Management Notes
While not in an overheated volatility zone, price fluctuations around events can still be significant. Currently neutral, an approach that prioritizes setting conditional entry criteria over directional bets is reasonable.
Pre-Decision Checks
- Have the direction of consensus EPS for the next two quarters (upward/downward) been confirmed?
- Can the financial structure (D/E, interest coverage, cash flow) withstand an economic slowdown?
- Does the entry price secure a risk-reward ratio of at least 1:2 relative to support/resistance levels?
- Are dividend policy (increase/maintain/cut) and share buyback policies consistently followed?
- Has the maximum acceptable loss in the event of a pessimistic scenario been predefined?
Conclusion (Optimistic, Base, Pessimistic 3 Scenarios)
| Scenario | Assumption | Key Trigger | Target Price (Model) | Expected Return |
|---|---|---|---|---|
| Optimistic | Earnings surprise accompanied by multiple expansion | Accelerating revenue growth and upward guidance revision | $31.91 | 17.8% |
| Base | Earnings meet consensus, multiples remain neutral | Successful margin defense and supply/demand stabilization | $28.49 | 5.2% |
| Pessimistic | Earnings slowdown coupled with multiple contraction | Downward guidance revision and widening risk premium | $23.36 | -13.8% |
The base scenario target price is $28.49. However, given the wide gap between the optimistic scenario (17.8%) and the pessimistic scenario (-13.8%), this stock is in a phase where 'conditional response' is more critical than finding the 'correct answer.'
Data Sources
- Data As Of:
2026-02-25 - Report Generated On:
2026-02-25 - Original Stock Link: https://finance.yahoo.com/quote/PFE
- Source Data: Yahoo Finance Price/Quote
Related Reports
Recent notes from the same market to compare assumptions.
- JPMorgan Chase(JPM) 289.48 | 3M -8.4% | Vol 26.8% | Risk Management Priority Zone (As of: 2026-03-06) (As-of 2026-03-06)
- Broadcom(AVGO) 330.48 | 3M -13.3% | Vol 37.5% | Entry Timing Check Zone (As of: 2026-03-06) (As-of 2026-03-06)
- Meta Platforms(META) 644.86 | 3M -2.5% | Vol 40.0% | Entry Timing Check Zone (As of: 2026-03-06) (As-of 2026-03-06)
- Exxon Mobil(XOM) 151.21 | 3M +29.1% | Vol 28.3% | Entry Timing Check Zone (As of: 2026-03-06) (As-of 2026-03-06)