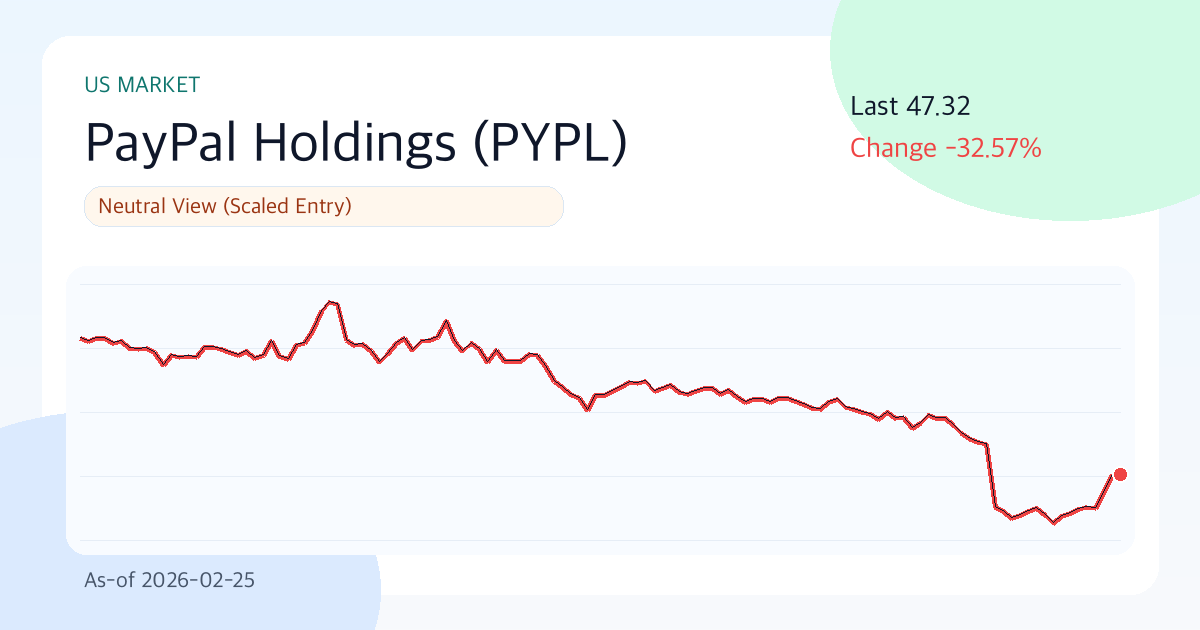
PayPal (PYPL) $47.32 | 3-Month Return -21.9% | Volatility 69.3% | Entry Timing Check (As of: 2026-02-25)
Summary
- One-Line Verdict: Neutral Stance (Phased Approach)
- Confidence Level: Moderate
- Commentary: PayPal's overall score is 58.1. Value: 64.3, Technicals: 35.4, Risk: 84.0. Current price is $47.32, with short-term support/resistance at $39.08/$57.66. 30-day annualized volatility is high at 69.3%.
Key Points (3 Lines)
- The key point for this period is whether the stock price can find support above the 20-day moving average ($44.09). If it holds, short-term supply/demand dynamics could turn favorable.
- The combination of a 17.5% margin and 25.7% ROE signals that core business competitiveness is not weak. However, the debt-to-equity ratio (D/E) of 0.61 requires monitoring sensitivity to interest rate fluctuations.
- Considering a dividend yield of 1.2% and an average payout ratio of 2.6%, dividend sustainability is assessed as 'Good'.
Looking at PayPal's chart today, the rhythm catches the eye before the numbers. This is a period of both rough currents and high waves, so it's wiser to pre-determine 'under what conditions to change strategy' rather than making hasty judgments.
Investment Thesis (Value)
When momentum is weak, one must examine the intrinsic quality of the numbers rather than the story. If PayPal's earnings quality is maintained and the market's valuation of those earnings (PER 8.8x, PBR 2.1x) doesn't become unreasonably low, the current valuation will appear more reasonable over time.
The core question is this: 'Can the combination of solid financial health (operating margin 17.5%, ROE 25.7%) and current price momentum (3-month -21.9%) lead to a stock price re-rating in the next 1-2 quarters?'
- Growth: A revenue growth rate of 3.7% suggests potential for slowing growth.
- Profitability: An operating margin of 17.5% and ROE of 25.7% indicate top-tier competitiveness within the industry.
- Valuation: PER of 8.8x and PBR of 2.1x are considered neutral to reasonable.
- Capital Returns: Considering an average payout ratio of 2.6% and a dividend yield of 1.2%, shareholder return attractiveness is limited.
Unique Argument of This Report (Rationale)
- The primary basis for judgment at this moment is the recent 3-month return of -21.9% and the supply/demand direction indicated by its position relative to the 20-day moving average ($44.09).
- The company's financial strength is assessed by its operating margin of 17.5% and ROE of 25.7%. A simultaneous decline in both these metrics could weaken the investment thesis.
- The current valuation is PER 8.8x and PBR 2.1x. The core of this report is finding the answer to the question: 'Is this valuation excessive relative to a 3.7% growth rate?'
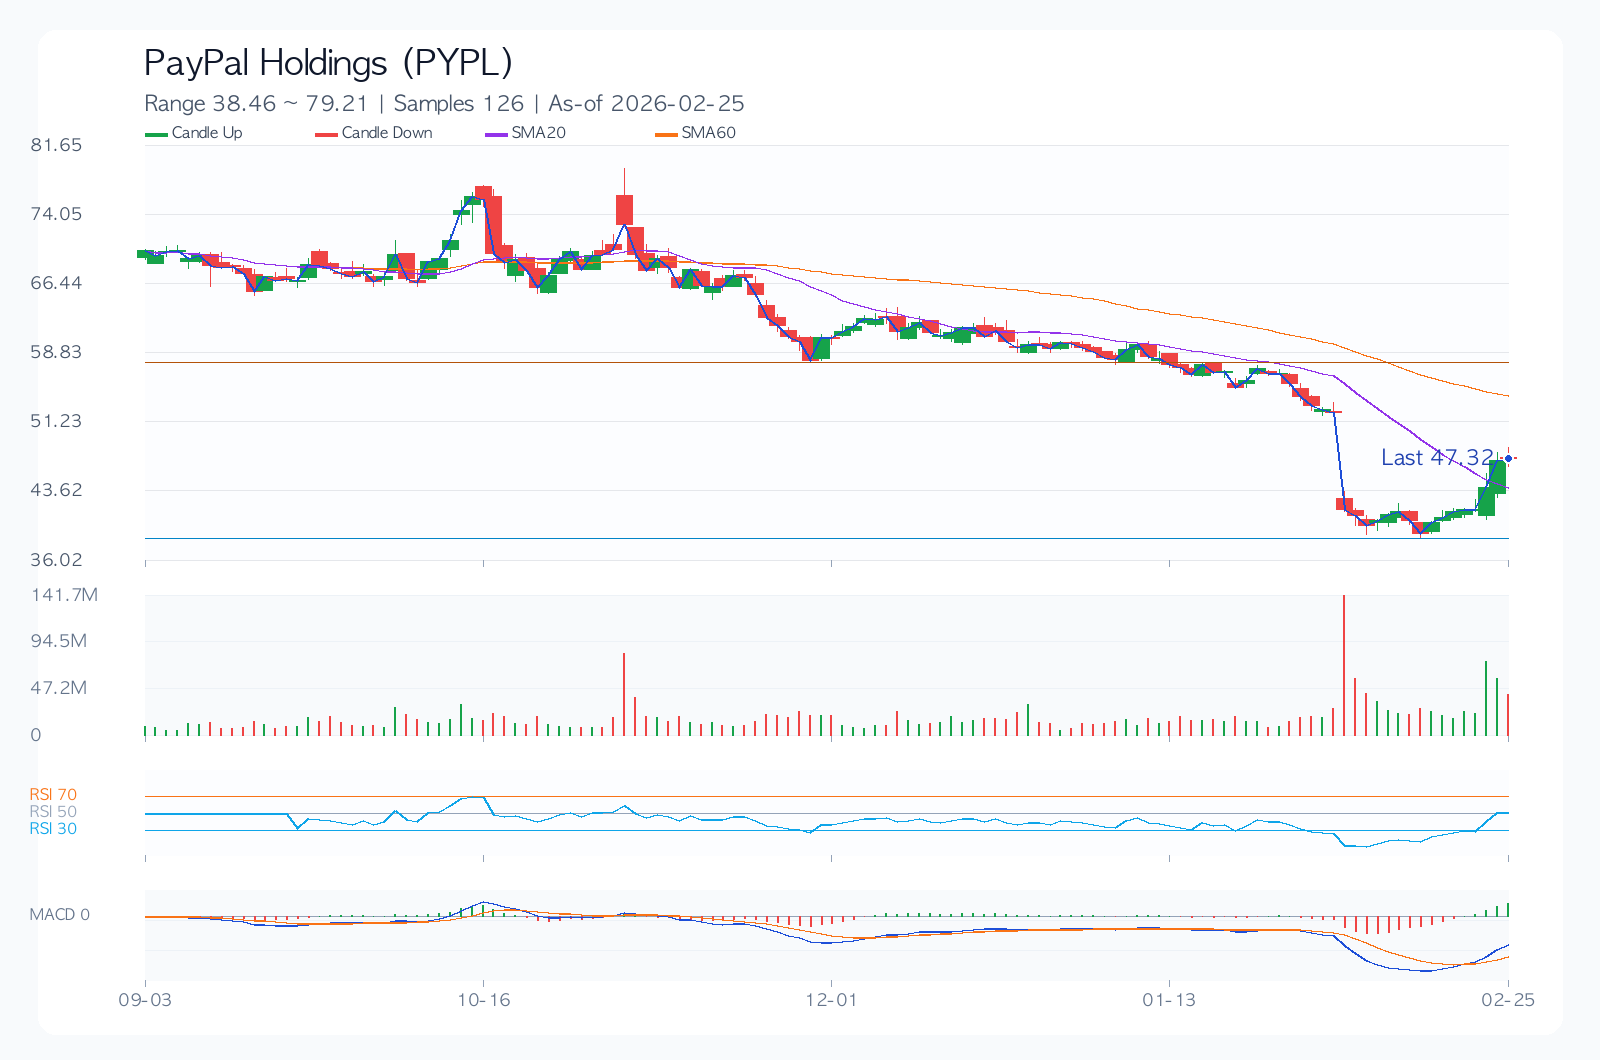
Technical Analysis
Technically, the market has already priced in optimistic expectations. Now, level management is more important than chasing the rally. The stock's performance is likely to be largely determined by its movement between the support level of $39.08 and the resistance level of $57.66.
- Trend: The 20-day, 60-day, and 120-day moving averages are at $44.09, $54.22, and $60.80, respectively, indicating a mixed or bearish arrangement.
- Momentum: 1-month -14.8%, 3-month -21.9%, 6-month -32.6%, showing high directional uncertainty.
- Overbought/Oversold: The RSI(14) is at 73.2, signaling an entry into overbought territory.
- Volatility/Drawdown: 30-day annualized volatility of 69.3% and a maximum drawdown of -57.4% serve as important criteria for position sizing.
- Price Levels: A trend reversal is likely when the short-term support at $39.08 or resistance at $57.66 is broken or breached.
Desk Memo (Light Commentary)
Today's market calls for stop-loss rules before coffee. Given the high volatility, simply reducing position size can significantly mitigate fluctuations in returns.
Key Chart
Financial Statements & Indicators
| Category | Value |
|---|---|
| Overall Score | 58.1/100 |
| Value/Technicals/Risk | 64.3 / 35.4 / 84.0 |
| Current Price | 47.32 |
| 1M/3M/6M Return | -14.8% / -21.9% / -32.6% |
| 30-Day Annualized Volatility | 69.3% |
| Max Drawdown (MDD) | -57.4% |
| 52-Week Range | 39.08 ~ 78.22 |
| 20/60/120-Day MA | 44.09 / 54.22 / 60.80 |
| RSI(14) | 73.2 |
| Short-term Support/Resistance | 39.08 / 57.66 |
| Revenue Growth | 3.7% |
| Operating Margin | 17.5% |
| ROE | 25.7% |
| D/E | 0.61 |
| PER / PBR | 8.8 / 2.1 |
| Dividend Yield | 1.2% |
Dividends (History & Sustainability)
More important than the yield itself is the stability of the policy during economic turbulence. PayPal's current dividend policy is assessed as 'Good'.
| Year | DPS | Payout Ratio |
|---|---|---|
| 2022 | 0.00 | 2.6% |
| 2023 | 0.00 | 2.6% |
| 2024 | 0.00 | 2.6% |
| 2025 | 0.14 | 2.6% |
Investor Legend Perspective Simulation
The following content is not an exact replication of actual trades by investment legends. It is a style simulation applying the core questions of each investment philosophy to current data.
| Perspective | Style Score (0-100) | Current Focus | Hypothetical Action Scenario |
|---|---|---|---|
| Warren Buffett (Quality & Margin of Safety) | 67.3 | ROE 25.7%, Operating Margin 17.5%, D/E 0.61, PER 8.8 | Maintain on watch list, approach by waiting for valuation adjustment |
| Peter Lynch (Growth & Price Balance) | 29.7 | Revenue Growth 3.7%, PEG Ratio ~2.36, 6-Month Return -32.6% | Story exists, but growth appeal relative to price is weak |
| George Soros (Trend & Reflexivity) | 3.7 | 1M/3M Returns -14.8%/-21.9%, Volatility 69.3%, RSI 73.2 | Observe until trend reliability improves, only act on reversal signals |
Key Risks
Managing downside scenarios is more important than optimistic ones. For PayPal, risk management now acts as a seatbelt to protect the position, rather than a warning. Monitor changes in valuation (PER 8.8x, PBR 2.1x) and 30-day annualized volatility (69.3%) to manage the speed of downside risk.
- With annualized volatility at 69.3%, rapid fluctuations are possible before and after events, making adherence to stop-loss rules essential.
- The recent maximum drawdown of -57.4% was deep. If a downtrend resumes, there is a risk of breaking psychological support levels.
- Changes in consensus estimates and management guidance comments around earnings releases can significantly influence short-term stock direction.
- Regulatory, legal, or policy changes (antitrust, financial regulations, etc.) can drastically alter the valuation framework itself.
Counterarguments and Invalidation Conditions
The counterargument is clear: 'If valuation burden (PER 8.8x, PBR 2.1x) is high or demand slowdown is confirmed, the pace of multiple contraction could outpace earnings improvement.'
- If the stock price remains below the short-term support level of $39.08 for more than two weeks, the current upward trend assumption is invalidated.
- If next quarter's revenue growth slows to below 0.7%, growth-related assumptions need re-evaluation.
- If consensus EPS estimates are revised downward for four consecutive weeks after the earnings release, the base scenario should be adjusted downward.
Checklist
Must-See Before Next Disclosure/Earnings
- Confirm that next quarter's revenue growth rate remains above 1.7% in the upcoming earnings release.
- Closely monitor whether the stock price successfully defends the short-term support level of $39.08.
- Carefully observe whether the consensus EPS estimates from analysts are revised upward for four consecutive weeks.
Portfolio Management Notes
Given the high volatility, concentrated single-stock investments should be approached cautiously. Technically, it is nearing overbought territory, making entry on pullbacks after confirmation more favorable in terms of risk-reward.
Pre-Decision Checks
- Have the future direction (upward/downward revision) of EPS consensus estimates for the next two quarters been confirmed?
- Can the financial structure (debt ratio, interest coverage ratio, cash flow) maintain stability even in an economic slowdown?
- Does the entry price secure a risk-reward ratio of at least 1:2 relative to support/resistance levels?
- Are dividend policies (increase/maintain/decrease) and share buyback policies consistently maintained?
- In the event of a pessimistic scenario, has the maximum acceptable loss been pre-defined?
Conclusion (Optimistic, Base, Pessimistic 3 Scenarios)
| Scenario | Assumption | Key Trigger | Target Price (Model) | Expected Return |
|---|---|---|---|---|
| Optimistic | Earnings surprise and simultaneous increase in valuation multiples | Accelerating revenue growth and upward revision of earnings guidance | 52.41 | 10.8% |
| Base | Earnings meet consensus, and valuation multiples remain at current levels | Successful margin defense and neutral supply/demand conditions | 46.80 | -1.1% |
| Pessimistic | Simultaneous slowdown in earnings and contraction in valuation multiples | Downward revision of earnings guidance and expansion of risk premium | 38.37 | -18.9% |
The base scenario target price is $46.80. However, considering the wide gap between the optimistic target price (10.8% upside) and the pessimistic target price (18.9% downside), focusing on 'conditional responses' rather than 'finding the right answer' is a wiser approach for this stock.
Previous Report Prediction Verification
- Previous Report: 20260220-us-pypl
- Previous Verdict: Watch and Wait (Respond after confirmation)
- Previous Base Scenario Expected Return: -4.1%
- Realized Return Based on Current Data: 13.6%
- Evaluation: Directional Mismatch
Data Sources
- Data As Of:
2026-02-25 - Report Generation Date:
2026-02-25 - Original Stock Link: https://finance.yahoo.com/quote/PYPL
- Source Data: Yahoo Finance Price/Quote
Related Reports
Recent notes from the same market to compare assumptions.
- JPMorgan Chase(JPM) 289.48 | 3M -8.4% | Vol 26.8% | Risk Management Priority Zone (As of: 2026-03-06) (As-of 2026-03-06)
- Broadcom(AVGO) 330.48 | 3M -13.3% | Vol 37.5% | Entry Timing Check Zone (As of: 2026-03-06) (As-of 2026-03-06)
- Meta Platforms(META) 644.86 | 3M -2.5% | Vol 40.0% | Entry Timing Check Zone (As of: 2026-03-06) (As-of 2026-03-06)
- Exxon Mobil(XOM) 151.21 | 3M +29.1% | Vol 28.3% | Entry Timing Check Zone (As of: 2026-03-06) (As-of 2026-03-06)