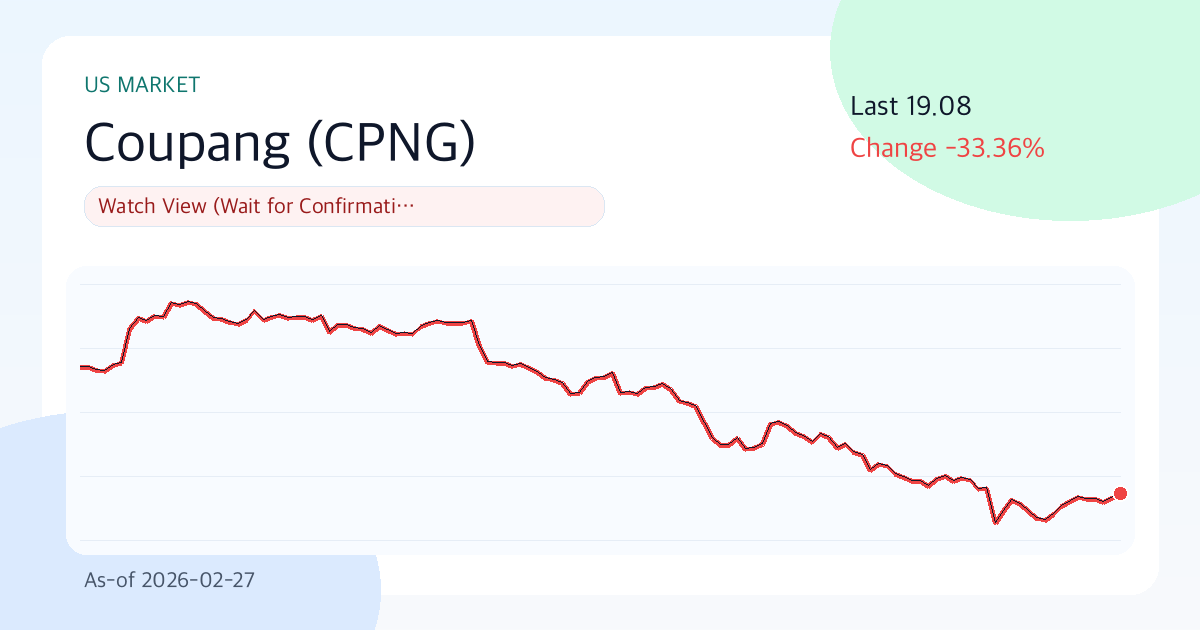
Coupang(CPNG) 19.08 | 3M -31.6% | Vol 53.8% | Risk Management Priority Zone (As of: 2026-02-27)
Summary
- One-line judgment: Wait-and-see approach (Respond after confirmation)
- Confidence level: Moderate
- Comment: Coupang, current price $19.08. Down 31.6% over 3 months with an annualized volatility of 53.8%. For now, it's time to focus on 'what to watch' rather than rapid price fluctuations.
Key Points (3 Lines)
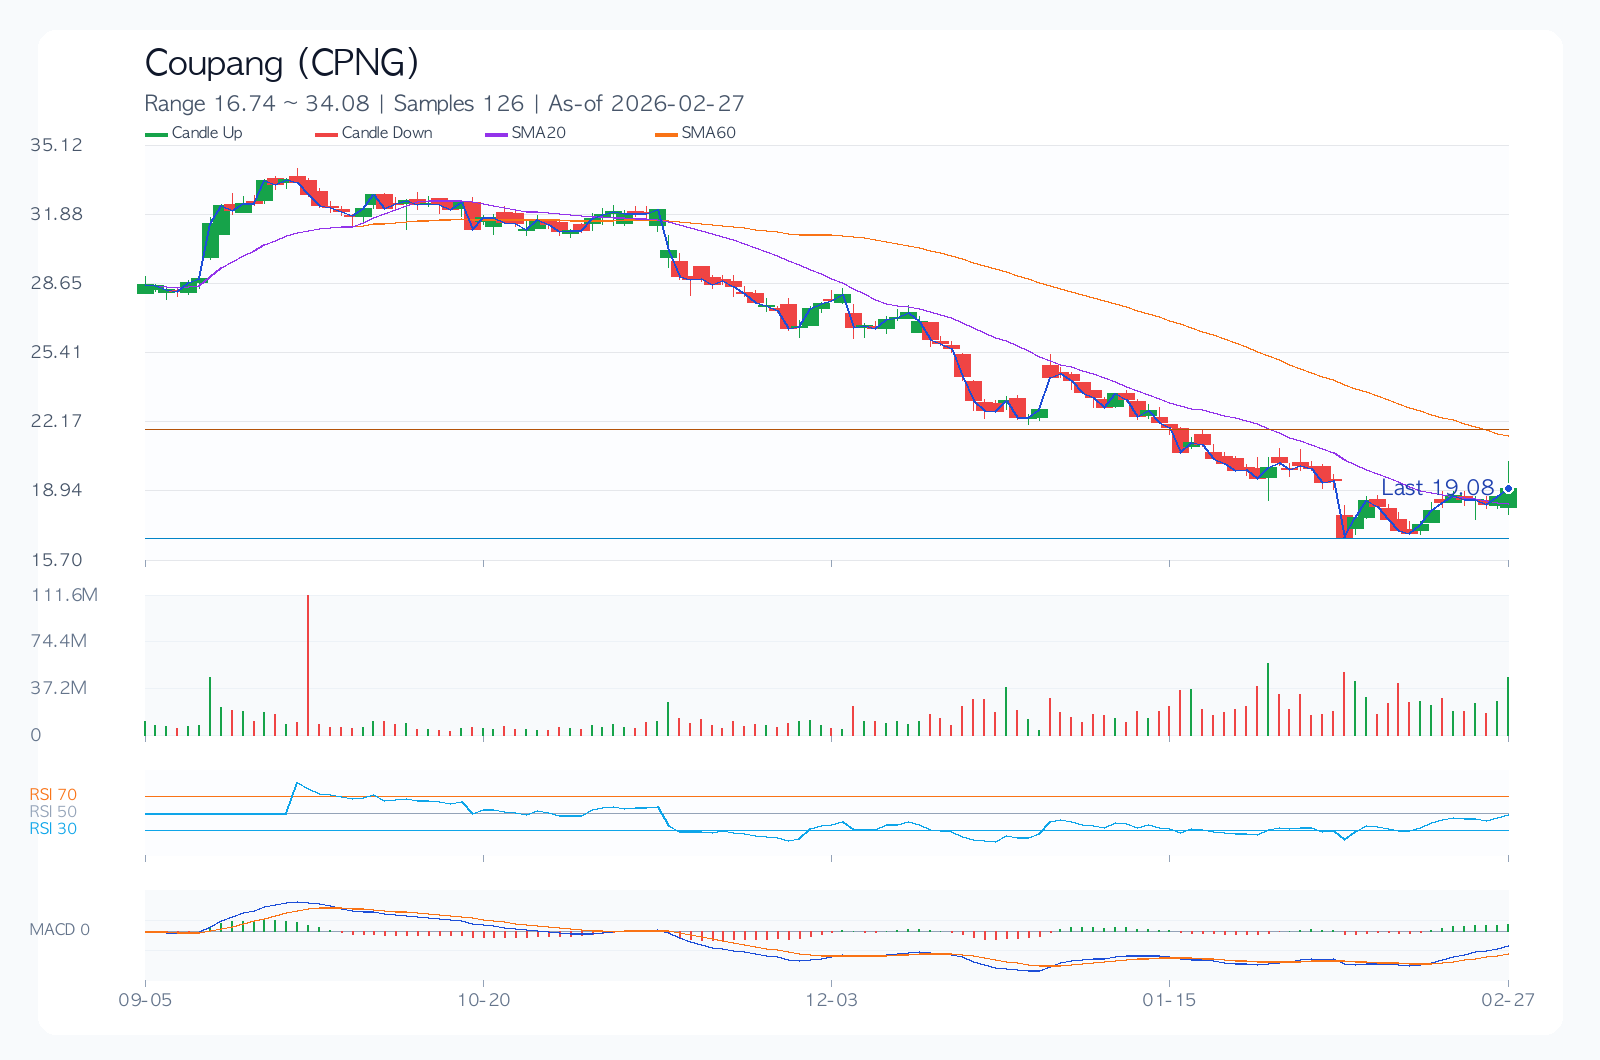
- The key point to watch in the current phase is whether the stock price stays above the 20-day moving average ($18.40). If it holds this level, short-term supply and demand are likely to be favorable.
- The combination of a -0.2% margin and 4.9% ROE signals that the core business's strength is not rapidly deteriorating, but the D/E ratio of 1.10 requires consideration of sensitivity to interest rate fluctuations.
- Given a dividend yield of 0.0% and an average payout ratio of 0.0%, dividend sustainability is assessed as 'Moderate'.
What first catches the eye on the Coupang chart is its rhythm, more than the numbers. This is a phase of mixed rough currents and high waves, so it's wiser to first decide 'when to change our response' rather than making hasty judgments.
Investment Thesis (Value)
In a phase of valuation pressure, even small earnings fluctuations can lead to significant stock price reactions. If the quality of Coupang's earnings is maintained and the market's valuation (PER 90.9, PBR 7.5) doesn't collapse rapidly, the current valuation may become justified over time.
The key question is whether the financial strength, represented by low margins (-0.2%) and ROE (4.9%), and the current stock momentum (-31.6%) can lead to a stock re-rating in the next 1-2 quarters. The core question is whether this valuation is excessive compared to the growth rate (10.9%).
- Growth: A revenue growth rate of 10.9% indicates a phase of top-line expansion.
- Profitability: An operating profit margin of -0.2% and ROE of 4.9% can be interpreted as being at the lower end of the normal range.
- Valuation: PER 90.9 and PBR 7.5 are classified as somewhat burdensome, overvalued territory.
- Capital Returns: An average payout ratio of 0.0% and a dividend yield of 0.0% limit the attractiveness from a shareholder return perspective.
Unique Argument of This Article (Basis)
- The primary basis for the current judgment is the recent 3-month return of -31.6% and the supply/demand direction above/below the 20-day moving average ($18.40).
- Financial soundness is assessed through an operating profit margin of -0.2% and ROE of 4.9%. If both indicators decline simultaneously, the investment thesis will be significantly weakened.
- Valuation indicators are PER 90.9 and PBR 7.5. The key is to determine 'whether this valuation is excessive compared to the growth rate of 10.9%'.
Technical Analysis
Technically, this is a point where conviction and doubt intersect. Therefore, level management (Support $16.79 / Resistance $21.25) is likely to determine most of the performance, rather than chasing the rally.
- Trend: The 20-day, 60-day, and 120-day moving averages are $18.40, $21.56, and $26.24, respectively, indicating a mixed or inverse trend.
- Momentum: 1-month -4.6%, 3-month -31.6%, 6-month -33.4%, indicating high uncertainty in direction.
- Overbought/Oversold: The RSI(14) index is at 62.9, located in the neutral zone.
- Volatility/Drawdown: 30-day annualized volatility of 53.8% and maximum drawdown of -49.9% serve as important criteria for position sizing.
- Price Levels: Trend reversal is more likely when the short-term support level of $16.79 or resistance level of $21.25 is broken or breached.
Desk Memo (Light Comment)
Today's market requires stop-loss rules before coffee. Given the high volatility, simply reducing position size can significantly reduce return fluctuations.
Key Chart
Financial Statements & Indicators
| Category | Value |
|---|---|
| Overall Score | 45.5/100 |
| Value/Technical/Risk | 38.9 / 41.0 / 68.0 |
| Current Price | 19.08 |
| 1M/3M/6M Return | -4.5% / -31.6% / -33.4% |
| 30-Day Annualized Volatility | 53.8% |
| Max Drawdown (MDD) | -49.9% |
| 52-Week Range | 16.79 ~ 33.53 |
| 20/60/120-Day MA | 18.40 / 21.56 / 26.24 |
| RSI(14) | 62.9 |
| Short-term Support/Resistance | 16.79 / 21.25 |
| Revenue Growth Rate | 10.9% |
| Operating Profit Margin | -0.2% |
| ROE | 4.9% |
| D/E | 1.10 |
| PER / PBR | 90.9 / 7.5 |
| Dividend Yield | 0.0% |
Dividends (History & Sustainability)
More important than the yield itself is whether the dividend policy is maintained during periods of economic and earnings instability. Current dividend sustainability is at a 'Moderate' level.
| Year | DPS | Payout Ratio |
|---|---|---|
| 2022 | 0.00 | 0.0% |
| 2023 | 0.00 | 0.0% |
| 2024 | 0.00 | 0.0% |
| 2025 | 0.00 | 0.0% |
Investment Guru Perspective Simulation
The following content is not a reproduction of actual investor trades, but a style simulation applying the core questions of each investment philosophy to current data.
| Perspective | Style Score (0-100) | Current Focus | Hypothetical Action Scenario |
|---|---|---|---|
| Warren Buffett (Quality/Margin of Safety) | 0.0 | ROE 4.9%, Operating Profit Margin -0.2%, D/E 1.10, PER 90.9 | Quality is noted, but insufficient price margin of safety; deferral. |
| Peter Lynch (Growth/Price Balance) | 0.0 | Revenue Growth Rate 10.9%, PEG Ratio ~8.34, 6-Month Return -33.4% | Story exists, but growth appeal relative to price is weak. |
| George Soros (Trend/Speed of Reaction) | 15.0 | 1M/3M Returns -4.5%/-31.6%, Volatility 53.8%, RSI 62.9 | Trend reliability is low; wait for confirmation signals, only act on signs of reversal. |
Key Risks
More important than good scenarios is how to respond when bad scenarios occur. In Coupang's case, the current risk mentions are closer to safeguards for maintaining a position rather than warnings. In this phase, valuation pressure (PER 90.9, PBR 7.5) and changes in 30-day annualized volatility (53.8%) can significantly influence the speed of downside risk.
- A PER of 90.9 requires a valuation re-rating, so failure to meet earnings expectations could lead to significant pressure for multiple contraction.
- Annualized volatility of 53.8% implies a high possibility of sharp fluctuations before and after events, making strict stop-loss rules essential.
- The low operating profit margin structure suggests difficulty in defending profits against rising costs or price competition.
- The recent maximum drawdown of -49.9% is deep, posing a risk of breaking psychological support levels if a downtrend resumes.
- Changes in consensus estimates and management's guidance comments around earnings releases can significantly influence short-term stock direction.
- Regulations, lawsuits, and policy changes (trade, antitrust, financial regulations, etc.) can drastically alter the valuation framework.
Counterarguments and Invalidation Conditions
The counterargument is that 'with high valuation pressure (PER 90.9, PBR 7.5) or clear signs of demand slowdown, multiple adjustments may outpace earnings improvement.'
- If the stock price remains below the short-term support level of $16.79 for more than two weeks, the current trend assumption is considered invalid.
- If the next quarter's revenue growth rate slows to below 7.9%, the growth assumption needs to be re-evaluated.
- If the consensus EPS is revised downward for four consecutive weeks after the earnings release, the base scenario will be lowered.
Checklist
Must-Watch Items Before Next Disclosure/Earnings
- Confirm that the revenue growth rate remains above 8.9% in the next quarterly earnings release.
- Closely monitor whether the stock price successfully defends the short-term support level of $16.79.
- Carefully observe whether the consensus EPS estimates are revised upward for four consecutive weeks.
Portfolio Management Notes
Due to high volatility, concentrated investment in a single stock is not recommended. In the current phase, an approach that first establishes conditional entry criteria is more rational than betting on direction.
Pre-Decision Checks
- Have the direction (upward/downward) of consensus EPS for the next two quarters been confirmed?
- Can the financial structure (debt-to-equity ratio, interest coverage ratio, cash flow) withstand an economic slowdown?
- Does the entry price secure a risk-reward ratio of at least 1:2 relative to support/resistance levels?
- Have dividend policies (increase/maintain/decrease) and share buyback policies been consistently followed?
- In the event of a pessimistic scenario, has the maximum acceptable loss limit been pre-defined?
Conclusion (Optimistic, Base, Pessimistic 3 Scenarios)
| Scenario | Assumption | Key Trigger | Target Price (Model) | Expected Return |
|---|---|---|---|---|
| Optimistic | Earnings surprise and simultaneous multiple expansion occur | Accelerating revenue growth and upward guidance revision | 19.00 | -0.4% |
| Base | Earnings meet consensus, and multiples remain at current levels | Margin defense and neutral supply/demand conditions maintained | 16.97 | -11.1% |
| Pessimistic | Earnings slowdown and simultaneous multiple decline occur | Downward guidance revision and widening risk premium | 13.91 | -27.1% |
The target price for the base scenario is $16.97. However, given the wide gap between the optimistic (-0.4%) and pessimistic (-27.1%) scenarios, it is reasonable to focus on 'conditional response' rather than finding a 'correct answer' for this stock.
Data Sources
- Data as of:
2026-02-27 - Report Generation Date:
2026-02-27 - Original Stock Link: https://finance.yahoo.com/quote/CPNG
- Source Data: Yahoo Finance Price/Quote
Related Reports
Recent notes from the same market to compare assumptions.
- JPMorgan Chase(JPM) 289.48 | 3M -8.4% | Vol 26.8% | Risk Management Priority Zone (As of: 2026-03-06) (As-of 2026-03-06)
- Broadcom(AVGO) 330.48 | 3M -13.3% | Vol 37.5% | Entry Timing Check Zone (As of: 2026-03-06) (As-of 2026-03-06)
- Meta Platforms(META) 644.86 | 3M -2.5% | Vol 40.0% | Entry Timing Check Zone (As of: 2026-03-06) (As-of 2026-03-06)
- Exxon Mobil(XOM) 151.21 | 3M +29.1% | Vol 28.3% | Entry Timing Check Zone (As of: 2026-03-06) (As-of 2026-03-06)