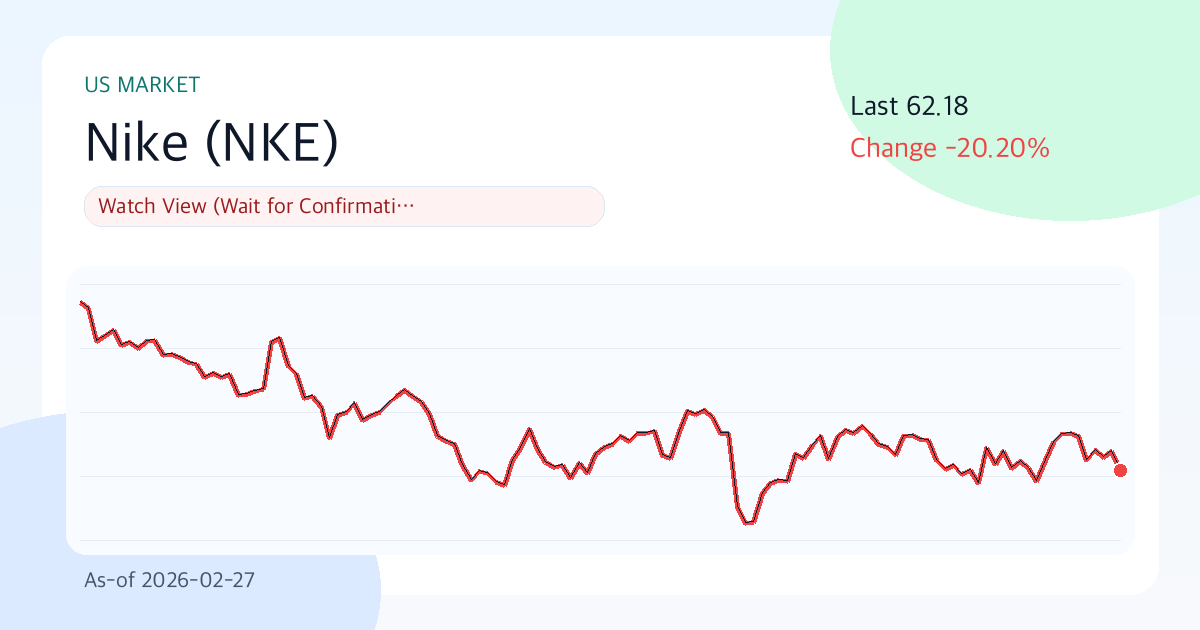
Nike (NKE) $62.18 | 3-Month Return -3.3% | 30-Day Volatility 32.1% | Risk Management Priority Zone (As of: 2026-02-27)
Summary
- One-Line Judgment: Wait-and-See Approach (Respond After Confirmation)
- Confidence Level: Moderate
- Comment: Nike (NKE) is currently at 47.6 points (Value 45.2, Technical 34.4, Risk 76.0). At the $62.18 price level, it is experiencing volatility of 32.1% between the short-term support at $60.93 and resistance at $65.61. It is important to clarify 'under what conditions the response will change' rather than relying solely on market predictions.
Key Points (3 Lines)
- The main point to watch in this period is whether the stock price holds above the 20-day moving average ($63.29). If this trend is maintained, short-term supply and demand are likely to be favorable.
- An operating profit margin of 8.1% and ROE of 17.9% suggest strong core business health, but a high debt-to-equity ratio (D/E 0.99) requires monitoring sensitivity to interest rate fluctuations.
- Considering a dividend yield of 2.6% and an average payout ratio of 94.2%, dividend sustainability is assessed as 'Cautionary'.
Nike's current chart speaks a rhythm beyond numbers. While headwinds are significant, opportunities are not entirely closed off. Therefore, it is wiser to pre-determine 'when and how to change the response' rather than making hasty judgments.
Investment Thesis (Value)
In periods of valuation pressure, even minor changes in earnings can lead to sensitive market reactions. If Nike's earnings quality is maintained and its current valuation (PER 36.4x, PBR 6.5x) does not collapse excessively, the current stock price has the potential to gain justification over time.
Whether Nike experiences a re-rating in the next 1-2 quarters depends on the harmony between its 'solid financial health (Operating Margin 8.1%, ROE 17.9%)' and 'current stock momentum (3-Month Return -3.3%)'.
- Growth: A revenue growth rate of 0.6% suggests potential for slowing growth.
- Profitability: An operating profit margin of 8.1% and ROE of 17.9% indicate top-tier profitability within the industry.
- Valuation: A PER of 36.4x and PBR of 6.5x are classified as being in a zone of overvaluation pressure.
- Capital Return: The combination of an average payout ratio of 94.2% and a dividend yield of 2.6% limits the attractiveness of shareholder returns.
Unique Argument of This Report (Basis)
- The primary basis for the current judgment is the supply and demand dynamics created by the recent 3-month return of -3.3% and the stock's position relative to the 20-day moving average ($63.29).
- Financial soundness should be assessed through an operating profit margin of 8.1% and ROE of 17.9%. If both indicators decline simultaneously, the investment thesis's persuasiveness will sharply decrease.
- Nike's key valuation metrics are a PER of 36.4x and a PBR of 6.5x. The core question of this report is whether this valuation is excessive relative to a 0.6% growth rate.
Technical Analysis
Technically, this is a point where conviction and doubt intersect. Rather than rushing into a chase to buy, 'how the support ($60.93) and resistance ($65.61) levels are managed' is likely to determine performance.
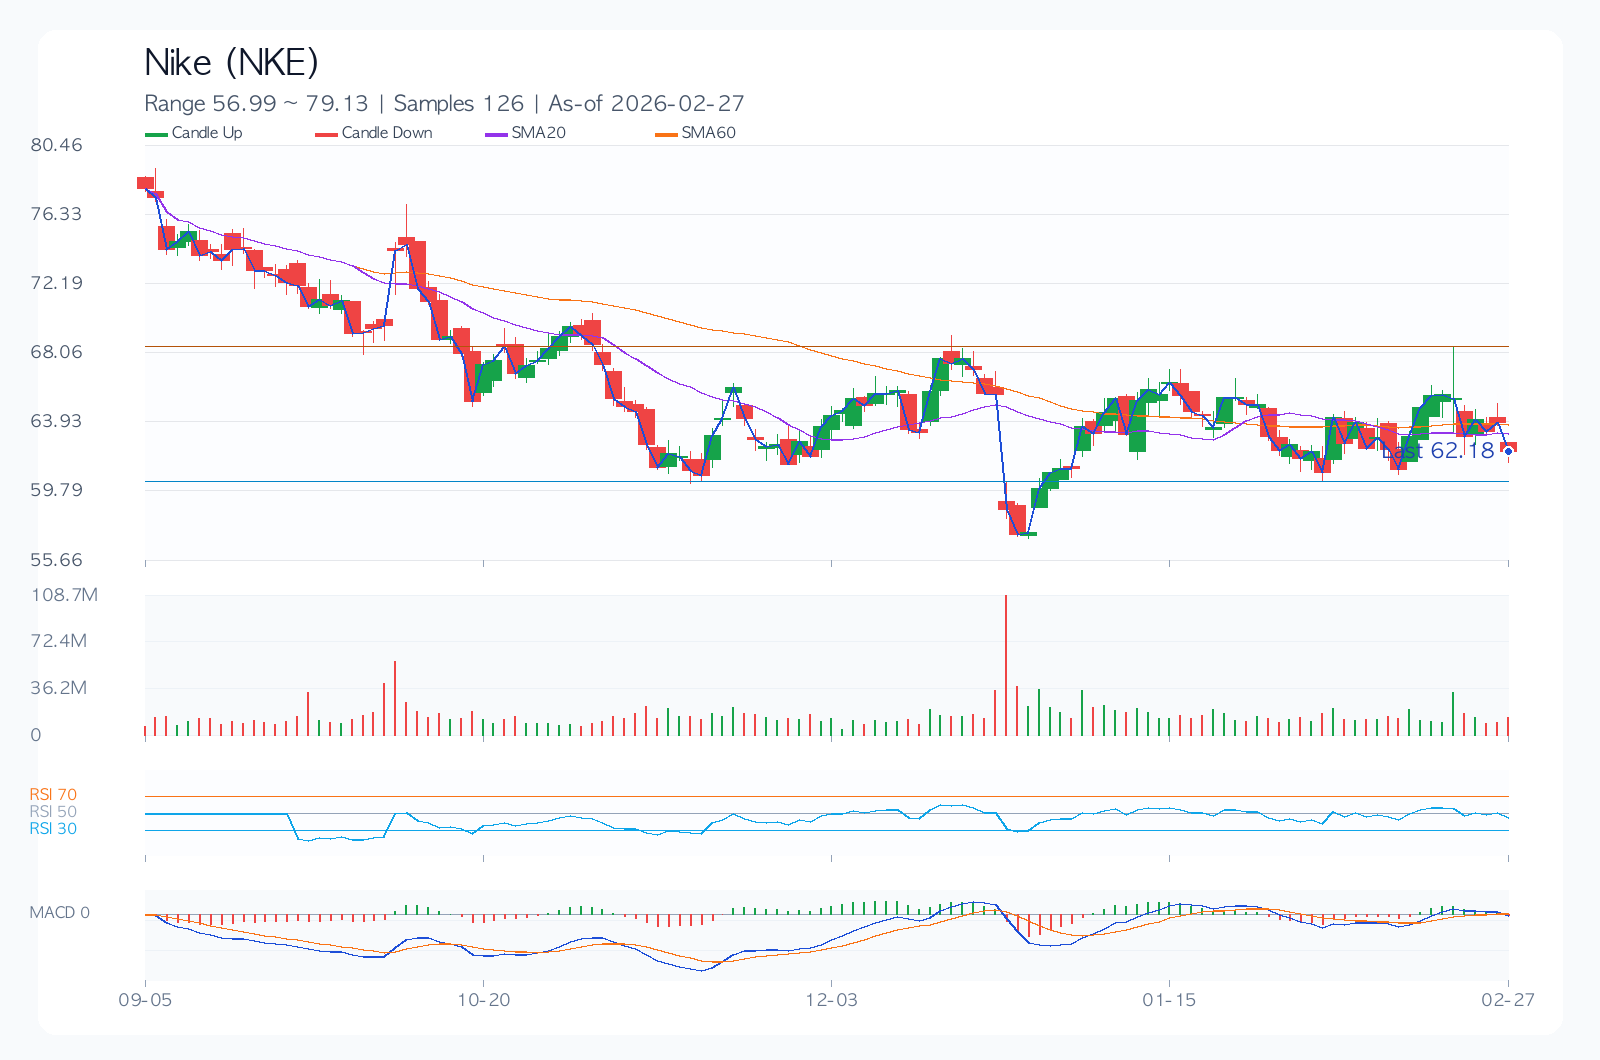
- Trend: The 20-day ($63.29), 60-day ($63.82), and 120-day ($65.71) moving averages are showing a mixed or bearish arrangement.
- Momentum: 1-month (-0.7%), 3-month (-3.3%), and 6-month (-20.2%) returns indicate uncertainty in direction.
- Overbought/Oversold: The RSI (14) is at 44.2, positioned in the neutral zone.
- Volatility/Drawdown: 30-day annualized volatility of 32.1% and a maximum drawdown of -49.0% serve as important benchmarks for position sizing.
- Price Levels: A trend reversal is likely upon breaking through or falling below the short-term support at $60.93 and resistance at $65.61.
Desk Memo (Light Commentary)
This may not be a period of dramatic market swings. However, adhering to principles in such 'everyday' market conditions can lead to consistent performance.
Key Chart
Financial Statements & Indicators
| Metric | Value |
|---|---|
| Overall Score | 47.6/100 |
| Value/Technical/Risk | 45.2 / 34.4 / 76.0 |
| Current Price | 62.18 |
| 1M/3M/6M Return | -0.7% / -3.3% / -20.2% |
| 30-Day Annualized Volatility | 32.1% |
| Max Drawdown (MDD) | -49.0% |
| 52-Week Range | 53.27 ~ 80.02 |
| 20/60/120 Day MA | 63.29 / 63.82 / 65.71 |
| RSI(14) | 44.2 |
| Short-Term Support/Resistance | 60.93 / 65.61 |
| Revenue Growth | 0.6% |
| Operating Margin | 8.1% |
| ROE | 17.9% |
| D/E | 0.99 |
| PER / PBR | 36.4 / 6.5 |
| Dividend Yield | 2.6% |
Dividends (History & Sustainability)
For Nike's dividends, the key is not the yield itself, but whether the policy remains stable even during economic downturns. The current 'Cautionary' rating reflects this concern.
| Year | DPS | Payout Ratio |
|---|---|---|
| 2022 | 1.25 | 94.2% |
| 2023 | 1.39 | 94.2% |
| 2024 | 1.51 | 94.2% |
| 2025 | 1.61 | 94.2% |
Investor Style Simulation
The following scenario-based analyses are not reproductions of actual trades by renowned investors but style simulations applying their core questions to current data.
| Perspective | Style Score (0-100) | Current Observation | Hypothetical Action Scenario |
|---|---|---|---|
| Warren Buffett (Quality/Margin of Safety) | 22.6 | ROE 17.9%, Operating Margin 8.1%, D/E 0.99, PER 36.4 | Quality confirmed, but insufficient price margin of safety; holding off. |
| Peter Lynch (Growth/Price Balance) | 0.0 | Revenue Growth 0.6%, PEG Ratio ~36.36, 6-Month Return -20.2% | Story exists, but growth appeal relative to price is weak. |
| George Soros (Trend/Speed of Reaction) | 37.2 | 1M/3M Returns -0.7%/-3.3%, Volatility 32.1%, RSI 44.2 | Low trend confidence; waiting for signals before acting, only responding to reversal signs. |
Key Risks
A plan for responding to failure is more important than a scenario with a high probability of success. For Nike, the current risk statement serves as a safety belt to protect positions rather than a warning. Changes in valuation (PER 36.4x, PBR 6.5x) and 30-day annualized volatility (32.1%) can influence the speed of downward pressure.
- A PER of 36.4x carries significant valuation pressure, increasing the likelihood of multiple compression if earnings fall short.
- A relatively low operating margin may make it difficult to defend profits against rising costs or increased price competition.
- The recent deep maximum drawdown of -49.0% poses a risk of breaking psychological support levels if a downtrend resumes.
- Changes in consensus estimates and management's guidance comments around earnings releases can significantly impact short-term stock direction.
- External factors such as global regulations, litigation, and trade policy changes can rapidly alter the valuation framework.
Contrarian Arguments and Invalidating Conditions
However, one must be wary of the possibility that 'valuation pressure (PER 36.4x, PBR 6.5x) combined with slowing demand could lead to multiple compression outpacing earnings improvement.'
- If the stock price remains below the short-term support level of $60.93 for more than two weeks, the current upward trend assumption will be considered invalid.
- If the next quarter's revenue growth slows to below 0.0%, the growth-related assumptions will require a complete re-evaluation.
- If consensus EPS estimates are revised downward for four consecutive weeks after an earnings release, the base scenario should be lowered.
Checklist
Must-See Before Next Announcement/Earnings
- Confirm whether the revenue growth rate remains at 0.0% or higher in the next quarterly earnings release.
- Observe whether the stock price successfully defends the short-term support level of $60.93.
- Monitor whether consensus EPS estimates show a trend of upward revision for four consecutive weeks.
Portfolio Management Notes
Current volatility is not excessive, but movements around earnings releases remain significant. It is more rational to focus on 'under what conditions to enter' rather than betting on direction.
Pre-Decision Checks
- Have you confirmed whether the EPS consensus for the next two quarters is being revised upward or downward?
- Can the financial structure, including the debt-to-equity ratio (D/E), interest coverage ratio, and cash flow, maintain stability even in an economic slowdown?
- When entering a purchase, does the current price offer a risk-reward ratio of at least 1:2 compared to support/resistance zones?
- Are dividend policies (increases, maintenance, reductions) and share buyback policies being consistently executed?
- In the event of a pessimistic scenario, have you clearly defined the maximum acceptable loss in advance?
Conclusion (Optimistic, Base, Pessimistic 3 Scenarios)
| Scenario | Assumption | Key Trigger | Target Price (Model) | Expected Return |
|---|---|---|---|---|
| Optimistic | Scenario where earnings surprise and valuation multiple defense are achieved simultaneously | Accelerating revenue growth and upward guidance revision | 63.66 | 2.4% |
| Base | Scenario where earnings meet consensus expectations and valuation multiples remain at current levels | Successful margin defense and supply-demand balance maintenance | 56.84 | -8.6% |
| Pessimistic | Scenario where earnings slowdown and valuation multiple contraction occur simultaneously | Guidance downgrade and widening risk premium | 46.61 | -25.0% |
The target price for the base scenario is $56.84. However, considering the wide gap between the optimistic scenario (2.4% increase) and the pessimistic scenario (-25.0% decrease), this stock requires a focus on 'conditional responses' rather than finding a definitive 'answer'.
Data Sources
- Data As Of:
2026-02-27 - Report Generated On:
2026-02-27 - Original Stock Link: https://finance.yahoo.com/quote/NKE
- Source Data: Yahoo Finance Price/Quote
Related Reports
Recent notes from the same market to compare assumptions.
- JPMorgan Chase(JPM) 289.48 | 3M -8.4% | Vol 26.8% | Risk Management Priority Zone (As of: 2026-03-06) (As-of 2026-03-06)
- Broadcom(AVGO) 330.48 | 3M -13.3% | Vol 37.5% | Entry Timing Check Zone (As of: 2026-03-06) (As-of 2026-03-06)
- Meta Platforms(META) 644.86 | 3M -2.5% | Vol 40.0% | Entry Timing Check Zone (As of: 2026-03-06) (As-of 2026-03-06)
- Exxon Mobil(XOM) 151.21 | 3M +29.1% | Vol 28.3% | Entry Timing Check Zone (As of: 2026-03-06) (As-of 2026-03-06)