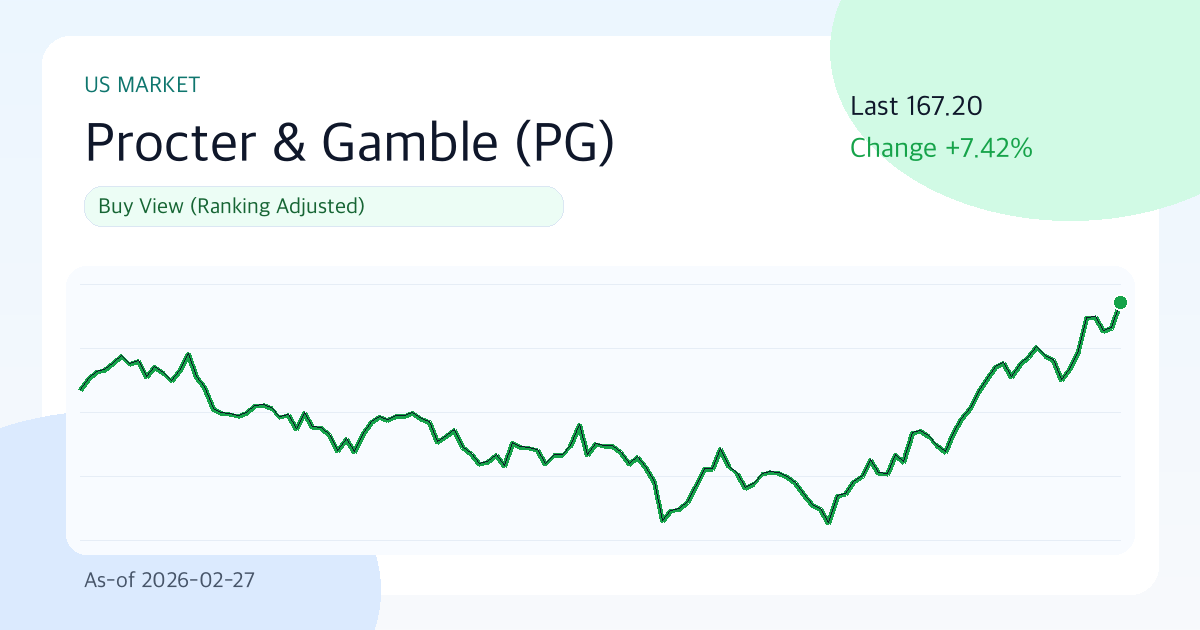
Procter & Gamble(PG) 167.20 | 3M +12.8% | Vol 18.3% | Examining Entry Timing Amid Valuation Concerns (As of: 2026-02-27)
Summary
- One-Line Verdict: Buy (Rank Adjusted)
- Confidence Level: High
- Comment: Procter & Gamble (PG) currently has a composite score of 67.9, with investor sentiment indicators suggesting a buy. Based on a recent 3-month momentum of +12.8% and supply/demand dynamics forming above the 20-day moving average (159.66), it's time to assess the potential for a re-rating within the next 1-2 quarters. However, a cautious approach is necessary, considering valuation concerns and the possibility of slowing growth.
Key Points (3 Lines)
- The key focus for this period is whether the stock price can maintain stability above the 20-day moving average (159.66). If this level holds, short-term supply/demand is likely to remain favorable.
- While solid fundamentals like a 26.3% profit margin and 31.6% ROE are positive, the debt-to-equity ratio (0.70) necessitates monitoring sensitivity to interest rate fluctuations.
- A 2.6% dividend yield and an average payout ratio of 61.9% are attractive from a shareholder return perspective, but the sustainability of the dividend is assessed as 'Moderate'.
The current phase of the Procter & Gamble chart, as indicated by the numbers, is one of strong fundamentals coupled with sustained upward momentum. However, with the ripple of valuation concerns present, it's time to prioritize investing without losing ground above the baseline.
Investment Thesis (Value)
In periods of valuation pressure, the quality of earnings and sustainability of growth are paramount. If Procter & Gamble can maintain the quality of its current earnings, and the market multiple assigned to these earnings (PER 24.8, PBR 7.4) does not drastically collapse due to unexpected demand slowdown or increased competition, the current valuation will become justifiable over time.
The core thesis hinges on whether "robust financial health (26.3% operating margin, 31.6% ROE) and solid short-term momentum (+12.8% over 3 months) can justify the current valuation (PER 24.8, PBR 7.4) over the next 1-2 quarters, driving further re-rating."
- Growth: Current revenue growth of 1.5% is below market expectations, suggesting potential for slowing growth.
- Profitability: An operating margin of 26.3% and ROE of 31.6% are highly competitive within the industry.
- Valuation: A PER of 24.8x and PBR of 7.4x are somewhat high relative to growth, classifying it as a valuation concern area.
- Capital Returns: An average payout ratio of 61.9% and a dividend yield of 2.6% are positive factors enhancing shareholder return attractiveness.
Unique Arguments of This Article (Rationale)
- The primary basis for judging the stock price trend is the direction of supply/demand above/below the 20-day moving average (159.66) and the sustainability of the recent 3-month return (12.8%).
- The core business strength is assessed by an operating margin of 26.3% and ROE of 31.6%; if both indicators decline simultaneously, the investment thesis will rapidly weaken.
- Key valuation metrics are PER 24.8x and PBR 7.4x, and whether these valuations are reasonable compared to the current low growth rate (1.5%) is the core of this investment decision.
Technical Analysis
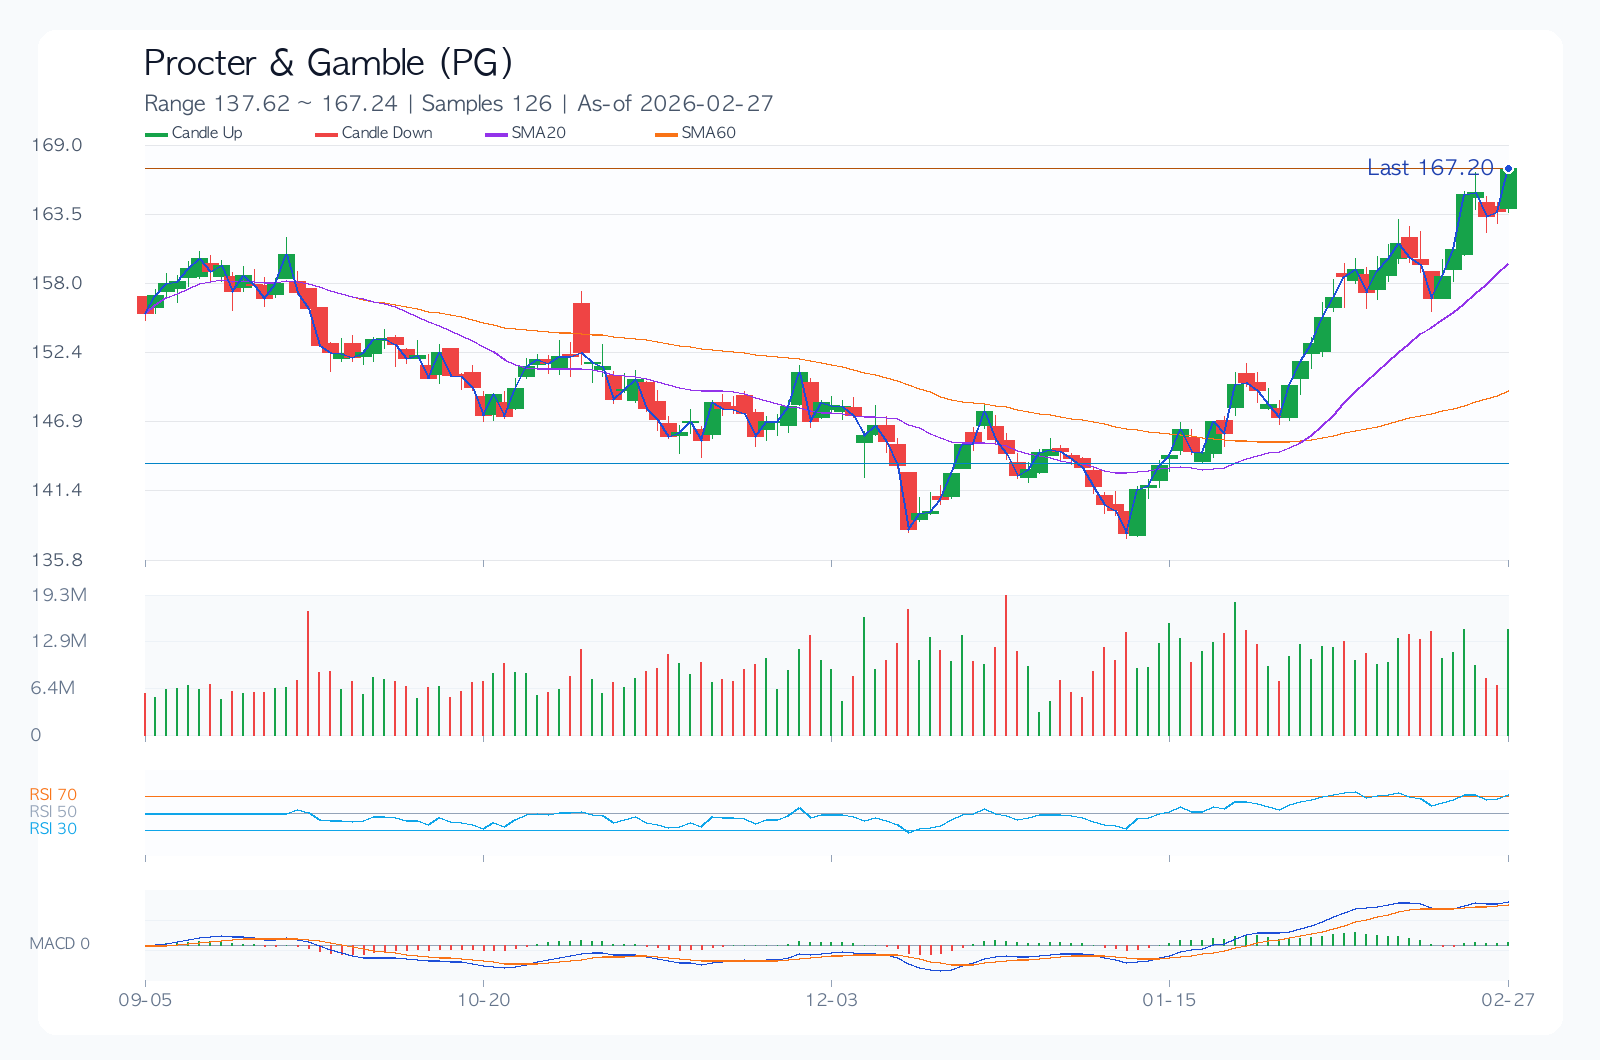
Technically, the stock is trading above the 20-day moving average (159.66), indicating favorable short-term supply/demand, but it is facing resistance near the 52-week high (176.26), placing it in a somewhat ambiguous zone. Therefore, rather than chasing the rally, it is crucial to manage levels between the support (144.53) and resistance (167.20) lines, with a principle of acting only upon specific conditions being met.
- Trend: The 20-day (159.66), 60-day (149.43), and 120-day (150.30) moving averages are mixed or in a weak bearish arrangement, suggesting a sideways trend rather than a clear trend.
- Momentum: 1-month (11.5%) and 3-month (12.8%) upward momentum is positive, but the 6-month (7.4%) shows some slowdown.
- Overbought/Oversold: The RSI (14) indicator is at 66.6, positioning it in neutral territory, neither overbought nor oversold.
- Volatility/Drawdown: 30-day annualized volatility of 18.3% and a maximum drawdown of -23.2% serve as important references for position sizing.
- Price Levels: Potential for trend reversal should be considered when breaking through or falling below the short-term support at 144.53 and resistance at 167.20.
Desk Memo (Brief Comments)
In times of overall market uncertainty, it is important to pay attention to the movements of relatively stable companies like P&G. Investing with discipline, even in a calm market, leads to meaningful long-term performance.
Key Chart
Financial Statements & Indicators
| Metric | Value |
|---|---|
| Composite Score | 67.9/100 |
| Value/Technical/Risk | 59.9 / 60.0 / 100.0 |
| Current Price | 167.20 |
| 1M/3M/6M Return | 11.5% / 12.8% / 7.4% |
| 30-Day Annualized Volatility | 18.3% |
| Max Drawdown (MDD) | -23.2% |
| 52-Week Range | 138.04 ~ 176.26 |
| 20/60/120-Day MA | 159.66 / 149.43 / 150.30 |
| RSI(14) | 66.6 |
| Short-Term Support/Resistance | 144.53 / 167.20 |
| Revenue Growth | 1.5% |
| Operating Margin | 26.3% |
| ROE | 31.6% |
| D/E | 0.70 |
| PER / PBR | 24.8 / 7.4 |
| Dividend Yield | 2.6% |
Dividends (History & Sustainability)
The attractiveness of a dividend lies not only in its yield but also in its 'sustainability' – its ability to be paid consistently even during economic downturns or performance declines. P&G's dividend sustainability is assessed as 'Moderate'.
| Year | DPS | Payout Ratio |
|---|---|---|
| 2022 | 3.61 | 61.9% |
| 2023 | 3.74 | 61.9% |
| 2024 | 3.96 | 61.9% |
| 2025 | 4.18 | 61.9% |
Investor Legend Perspective Simulation
The following scenarios do not fully reflect the complexities of the actual market; they simulate style-based responses by applying the core questions of each investment philosophy to current data.
| Perspective | Style Score (0-100) | Current Focus | Hypothetical Action Scenario |
|---|---|---|---|
| Warren Buffett (Quality/Margin of Safety) | 65.4 | ROE 31.6%, Operating Margin 26.3%, D/E 0.70, PER 24.8 | Maintain on watch list; approach of waiting for valuation adjustments. |
| Peter Lynch (Growth/Price Balance) | 0.0 | Revenue Growth 1.5%, PEG Ratio ~16.51, 6-Month Return 7.4% | Story exists, but growth appeal relative to price is weak. |
| George Soros (Trend/Reaction Speed) | 72.1 | 1M/3M Return 11.5%/12.8%, Volatility 18.3%, RSI 66.6 | View as a fast-reacting price phase; strengthen short-term trading perspective upon catalyst emergence. |
Key Risks
Realistic risk management goes beyond simply hoping for the best. For Procter & Gamble, valuation concerns (PER 24.8, PBR 7.4) combined with 30-day annualized volatility (18.3%) could act as downward pressure. Therefore, a rapid expansion of valuation multiples or increased volatility could be strong triggers for position adjustment. While the current price range is not one to easily lose, if it breaks, a swift change in strategy is necessary.
- At the next earnings announcement, guidance deviating from expectations or changes in consensus could significantly impact short-term stock price direction.
- Increased global regulation, changes in trade policy, interest rate hikes, and other macroeconomic and policy uncertainties could rapidly alter the valuation framework.
- Monitor the potential for weakening market share and profit margin defense due to increased competition in core business segments or the emergence of new technologies.
- Currency fluctuations and a global economic slowdown could negatively impact both Procter & Gamble's earnings and valuation.
Counterarguments and Invalidation Conditions
The counterargument is clear: in a high valuation environment (PER 24.8, PBR 7.4), earnings falling short of market expectations or visible future growth deceleration could lead to stock price declines as multiple compression outpaces earnings improvement.
- If the price remains below the short-term support level of 144.53 for more than two weeks, the current upward trend assumption must be discarded.
- If the next quarter's revenue growth is reported to slow to below 0.0%, a re-evaluation of growth drivers is necessary.
- If market consensus EPS estimates are revised downwards for four consecutive weeks following an earnings announcement, the base scenario should be downgraded.
Checklist
Must-See Before Next Announcement/Earnings
- Confirm that revenue growth of 0.0% or higher is maintained in the next quarterly earnings announcement.
- Closely observe whether the stock price successfully defends the short-term support level of 144.53.
- Continuously monitor whether market consensus EPS estimates are revised upwards over the next four weeks.
Portfolio Management Notes
While current volatility is not in an overheated zone, it may expand around key events (e.g., earnings announcements). Therefore, a conditional approach with clear entry/exit criteria is more rational than aggressive directional bets.
Pre-Decision Checks
- Have the direction (upward/downward) of consensus EPS for the next two quarters been clearly confirmed?
- Can the current financial structure (debt ratio, interest coverage ratio, cash flow) maintain stability even in an economic slowdown?
- Is the potential risk-reward ratio at least 1:2 from the entry price secured?
- Are the company's dividend policy (increase/maintain/decrease) and share buyback policy being consistently maintained?
- In the event of a downside scenario, has the maximum acceptable loss limit been clearly defined in advance?
Conclusion (Optimistic, Base, Pessimistic 3 Scenarios)
| Scenario | Assumption | Key Trigger | Target Price (Model) | Expected Return |
|---|---|---|---|---|
| Optimistic | Earnings surprise exceeding market expectations and simultaneous increase in valuation multiples. | Accelerating revenue growth and upward revision of consensus. | 195.61 | 17.0% |
| Base | Earnings meet market consensus, and current valuation multiples remain neutral. | Successful margin defense and stable supply/demand. | 174.65 | 4.5% |
| Pessimistic | Simultaneous deceleration in earnings and decline in valuation multiples. | Downward revision of guidance and expansion of risk premium. | 143.21 | -14.3% |
The base scenario target price is 174.65. However, the gap between the optimistic scenario (17.0% upside) and the pessimistic scenario (-14.3% downside) is quite wide in the current phase. Therefore, rather than seeking a 'correct answer,' developing a conditional response strategy based on clear triggers would be a wiser approach.
Data Sources
- Data As Of:
2026-02-27 - Report Generation Date:
2026-02-27 - Original Stock Link: https://finance.yahoo.com/quote/PG
- Source Data: Yahoo Finance Price/Quote
Related Reports
Recent notes from the same market to compare assumptions.
- JPMorgan Chase(JPM) 289.48 | 3M -8.4% | Vol 26.8% | Risk Management Priority Zone (As of: 2026-03-06) (As-of 2026-03-06)
- Broadcom(AVGO) 330.48 | 3M -13.3% | Vol 37.5% | Entry Timing Check Zone (As of: 2026-03-06) (As-of 2026-03-06)
- Meta Platforms(META) 644.86 | 3M -2.5% | Vol 40.0% | Entry Timing Check Zone (As of: 2026-03-06) (As-of 2026-03-06)
- Exxon Mobil(XOM) 151.21 | 3M +29.1% | Vol 28.3% | Entry Timing Check Zone (As of: 2026-03-06) (As-of 2026-03-06)