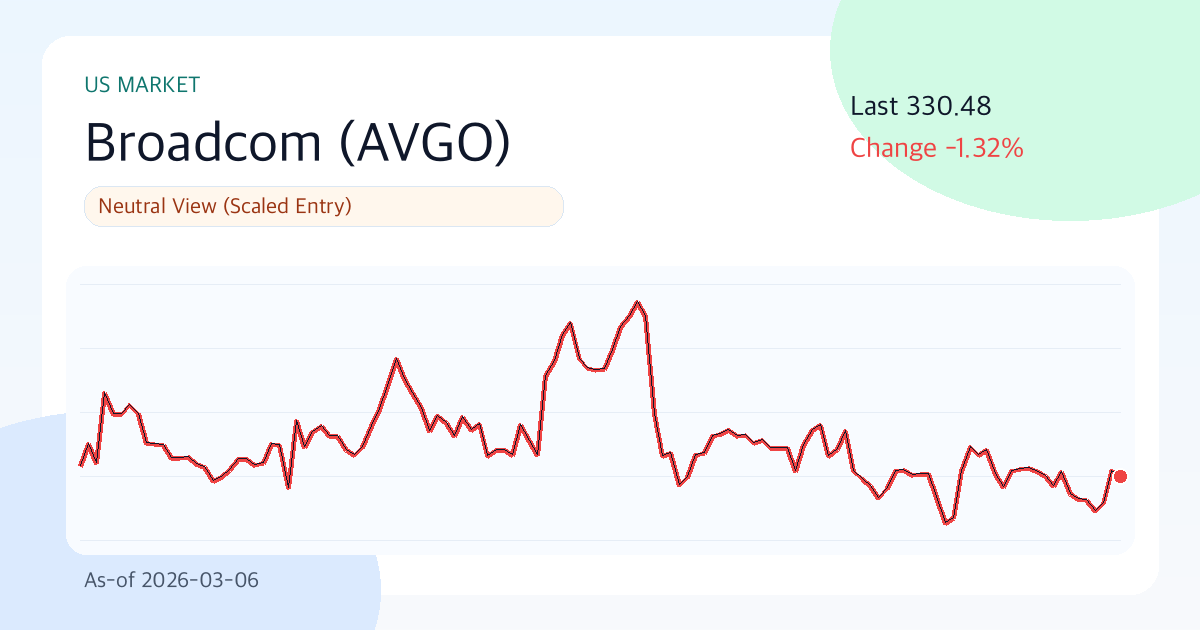
Broadcom(AVGO) 330.48 | 3M -13.3% | Vol 37.5% | Entry Timing Check Zone (As of: 2026-03-06)
Summary
- One-line judgment: Neutral Outlook (Phased Approach)
- Confidence: Moderate
- Comment: Broadcom, Overall Score 61.9. Valuation 62.5, Technical 49.6, Risk 82.0. Current Price 330.48, Short-term Support/Resistance 308.05/343.94, 30-day annualized volatility 37.5%. Phased approach with a neutral outlook, moderate confidence.
Key Points (3 Lines)
- The key point to watch in this phase is whether the price remains above the 20-day moving average (329.60). If it does, short-term supply and demand are likely to be favorable.
- The combination of a 31.8% margin and 33.4% ROE signals that the core business is not weak, but the D/E ratio of 0.14 requires checking interest rate sensitivity as well.
- Based on a dividend yield of 0.8% and an average payout ratio of 49.5%, dividend sustainability is rated 'Good'.
Looking at Broadcom's chart today, the first thing you notice is rhythm rather than numbers. The current phase is characterized by both rough currents and high waves, so it's more advantageous to first determine 'under what conditions the judgment will change' rather than rushing to conclusions.
Investment Logic (Valuation)
The core of this phase is whether growth and profitability are maintained simultaneously. If the quality of Broadcom's earnings remains stable and the market's valuation (PER 69.4, PBR 5.6) for those earnings does not collapse excessively, the current valuation will become more explanatory over time.
The core logic is whether the combination of financial strength (31.8% margin, 33.4% ROE) and current price momentum (-13.3%) can create a re-rating in the next 1-2 quarters.
- Growth: Revenue growth of 16.4% suggests a phase of top-line expansion.
- Profitability: An operating margin of 31.8% and ROE of 33.4% can be interpreted as potential for top-tier industry performance.
- Valuation: PER 69.4 and PBR 5.6 are classified as overvalued.
- Cash Return: The combination of an average payout ratio of 49.5% and a dividend yield of 0.8% limits the attractiveness of shareholder returns.
Unique Argument of This Report (Basis)
- The primary basis for the current judgment is the supply and demand directionality created by the recent 3-month return of -13.3% and the price's position above/below the 20-day moving average (329.60).
- Financial strength is assessed by operating margin (31.8%) and ROE (33.4%); if both of these decline simultaneously, the investment logic's quality will rapidly weaken.
- The valuation metrics are PER 69.4 and PBR 5.6, and the core of this report is 'whether this valuation is excessive relative to the 16.4% growth rate'.
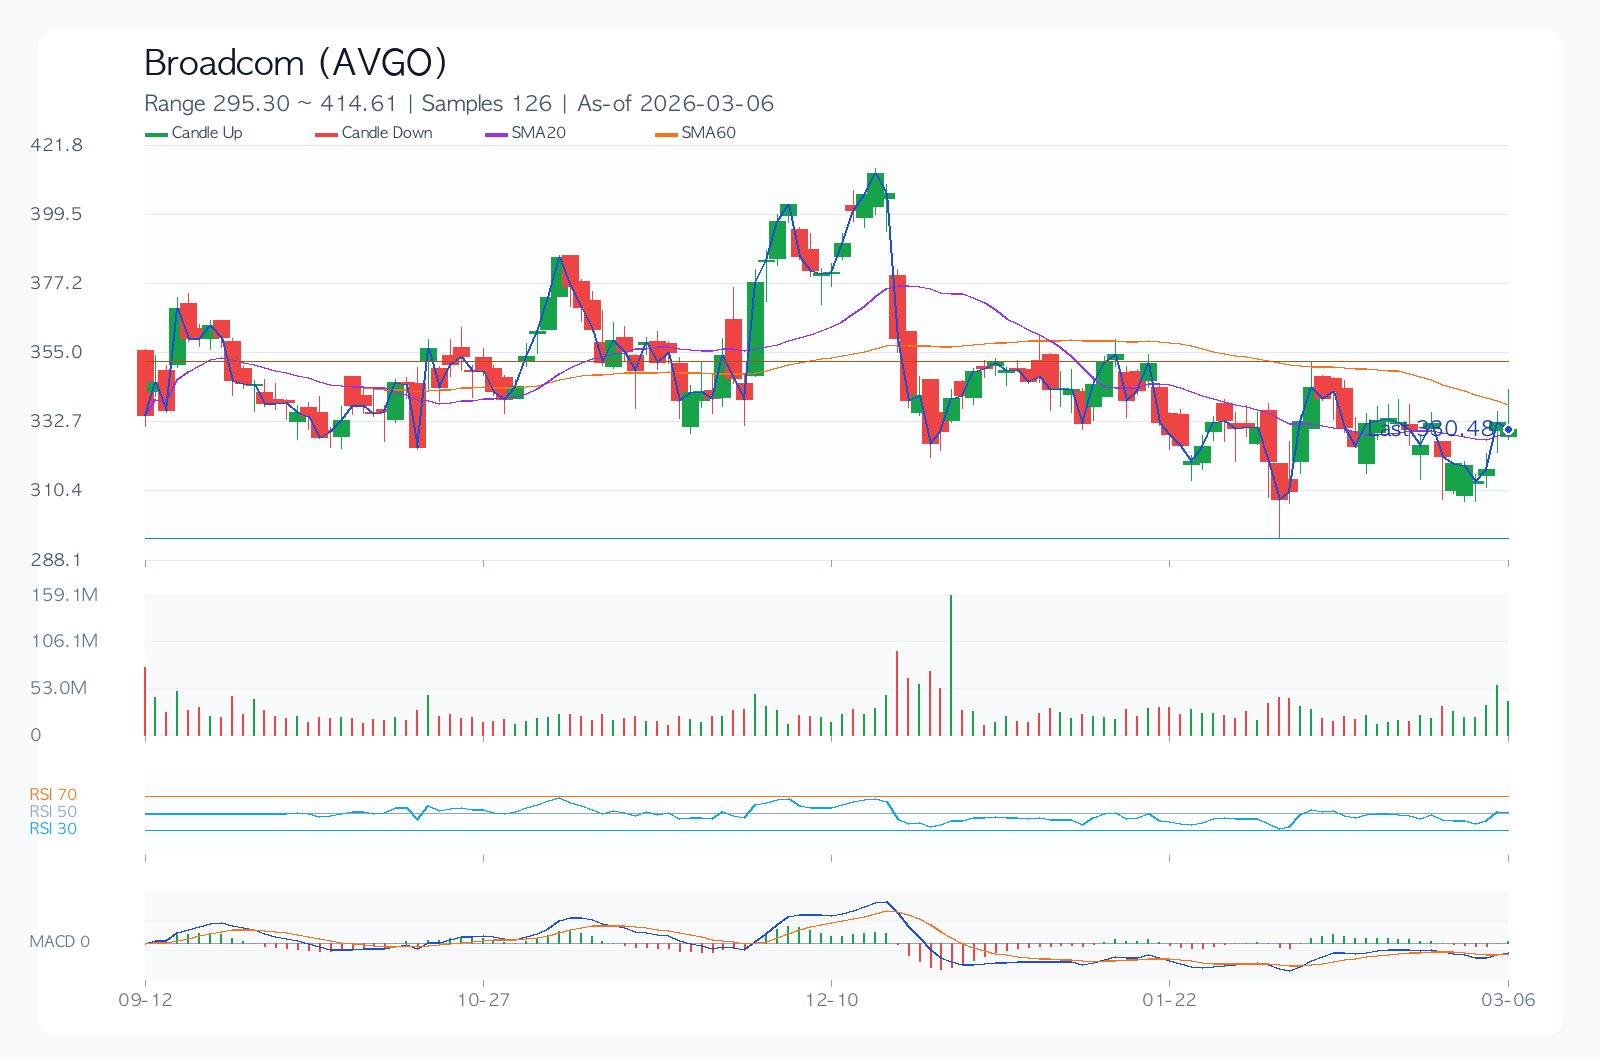
Technical Analysis
Technically, this is a juncture where conviction and doubt coexist. Therefore, level management (Support 308.05 / Resistance 343.94) is likely to account for most of the performance, rather than chasing the price.
- Trend: The 20-day/60-day/120-day moving averages are 329.60/338.67/346.77, indicating a mixed or bearish trend.
- Momentum: 1-month 6.4%, 3-month -13.3%, 6-month -1.3%, showing directional uncertainty.
- Overbought/Oversold: RSI(14) is 54.2, in neutral territory.
- Volatility/Drawdown: 30-day annualized volatility of 37.5% and maximum drawdown of -41.5% should be used as benchmarks for position sizing.
- Price Levels: A trend reversal is likely when the short-term support level of 308.05 or resistance level of 343.94 is broken or breached.
Desk Memo (Light Commentary)
While not a dramatic market, adhering to rules in these everyday market conditions actually generates performance.
Key Chart
Financial Statements/Indicators
| Category | Value |
|---|---|
| Overall Score | 61.9/100 |
| Valuation/Technical/Risk | 62.5 / 49.6 / 82.0 |
| Current Price | 330.48 |
| 1M/3M/6M Return | 6.4% / -13.3% / -1.3% |
| 30-day Annualized Volatility | 37.5% |
| Max Drawdown (MDD) | -41.5% |
| 52-Week Range | 146.29 ~ 412.97 |
| 20/60/120-day MA | 329.60 / 338.67 / 346.77 |
| RSI(14) | 54.2 |
| Short-term Support/Resistance | 308.05 / 343.94 |
| Revenue Growth Rate | 16.4% |
| Operating Margin | 31.8% |
| ROE | 33.4% |
| D/E | 0.14 |
| PER / PBR | 69.4 / 5.6 |
| Dividend Yield | 0.8% |
Dividends (History/Sustainability)
More important than the dividend yield itself is whether the policy is maintained even when the economy and earnings fluctuate. The current assessment is 'Good'.
| Year | DPS | Payout Ratio |
|---|---|---|
| 2022 | 1.69 | 49.5% |
| 2023 | 1.91 | 49.5% |
| 2024 | 2.17 | 49.5% |
| 2025 | 2.42 | 49.5% |
Investor Legend Perspective Simulation
The following is a style simulation that applies the core questions of each investment philosophy to the current data, rather than replicating actual trades by legendary investors.
| Perspective | Style Score (0-100) | Current Observation | Hypothetical Action Scenario |
|---|---|---|---|
| Warren Buffett (Quality/Margin of Safety) | 39.1 | ROE 33.4%, Operating Margin 31.8%, D/E 0.14, PER 69.4 | Confirms quality but deems the price margin of safety insufficient; holds off. |
| Peter Lynch (Growth/Price Balance) | 19.4 | Revenue Growth 16.4%, PEG Ratio approx. 4.23, 6-month Return -1.3% | Story exists, but growth appeal relative to price is weak. |
| George Soros (Trend/Responsiveness) | 42.7 | 1M/3M Returns 6.4%/-13.3%, Volatility 37.5%, RSI 54.2 | Low trend reliability; waits for confirmation signals, only acts on signs of reversal. |
Key Risks
Responding to bad scenarios is more important than good ones. For Broadcom, the current risk statement is less of a warning and more of a safety net for maintaining positions. In the current phase, changes in the valuation metrics (PER 69.4, PBR 5.6) and 30-day annualized volatility (37.5%) can significantly influence the speed of downside risk.
- At a PER of 69.4, it is in a re-rating zone for overvaluation, so there is significant pressure for multiple contraction in case of an earnings miss.
- With a maximum drawdown of -41.5% based on recent time series, there is a risk of breaking psychological lows if a downtrend resumes.
- Changes in consensus estimates and guidance comments before and after earnings announcements can influence short-term direction.
- Valuation frameworks can change rapidly due to regulations, lawsuits, or policy changes (trade/antitrust/financial regulations, etc.).
Counterarguments and Invalidation Conditions
The counterargument is that 'valuation burden (PER 69.4, PBR 5.6) or a slowdown in demand could lead to multiple adjustments faster than earnings improvements'.
- If the price remains below the short-term support level of 308.05 for more than two weeks, the current trend assumption will be considered invalid.
- If the next quarter's revenue growth slows to below 13.4%, the growth assumption needs re-evaluation.
- If the consensus EPS is revised downwards for four consecutive weeks after the earnings announcement, the base scenario will be adjusted downwards.
Checklist
Must-See Before Next Announcement/Earnings
- Confirm that revenue growth of 14.4% or higher is maintained in the next quarterly earnings.
- Confirm that the stock price defends the short-term support level of 308.05.
- Confirm that consensus EPS estimates are revised upwards for four consecutive weeks.
Portfolio Management Notes
Concentrating on a single stock is not recommended due to high volatility. Since the outlook is neutral, an approach that prioritizes setting conditional entry criteria over directional bets is reasonable.
Pre-Decision Checks
- Have the direction of consensus EPS for the next two quarters (upward/downward) been confirmed?
- Can the financial structure (D/E, interest coverage, cash flow) withstand an economic slowdown?
- Does the entry price secure a risk-reward ratio of at least 1:2 relative to support/resistance levels?
- Have dividend policies (increase/maintain/reduce) and share buyback policies been consistently followed?
- Has the maximum acceptable loss limit in the event of a pessimistic scenario been defined in advance?
Conclusion (Optimistic, Base, Pessimistic 3 Scenarios)
| Scenario | Assumption | Key Trigger | Target Price (Model) | Expected Return |
|---|---|---|---|---|
| Optimistic | Simultaneous earnings surprise and multiple defense | Accelerating revenue growth + upward guidance revision | 370.49 | 12.1% |
| Base | Earnings meet consensus, multiple remains neutral | Margin defense + neutral supply/demand | 330.79 | 0.1% |
| Pessimistic | Simultaneous earnings slowdown and multiple contraction | Downward guidance revision + increased risk premium | 271.25 | -17.9% |
The target price for the base scenario is 330.79. However, given the wide gap between the optimistic (12.1%) and pessimistic (-17.9%) scenarios, it is reasonable to view this stock as being in a phase where 'conditional response' is more important than finding the 'correct answer'.
Data Sources
- Data As of:
2026-03-06 - Report Generated On:
2026-03-07 - Original Stock Link: https://finance.yahoo.com/quote/AVGO
- Source Data: Yahoo Finance Price/Quote
Related Reports
Recent notes from the same market to compare assumptions.
- JPMorgan Chase(JPM) 289.48 | 3M -8.4% | Vol 26.8% | Risk Management Priority Zone (As of: 2026-03-06) (As-of 2026-03-06)
- Meta Platforms(META) 644.86 | 3M -2.5% | Vol 40.0% | Entry Timing Check Zone (As of: 2026-03-06) (As-of 2026-03-06)
- Exxon Mobil(XOM) 151.21 | 3M +29.1% | Vol 28.3% | Entry Timing Check Zone (As of: 2026-03-06) (As-of 2026-03-06)
- Coupang(CPNG) 19.08 | 3M -31.6% | Vol 53.8% | Risk Management Priority Zone (As of: 2026-02-27) (As-of 2026-02-27)