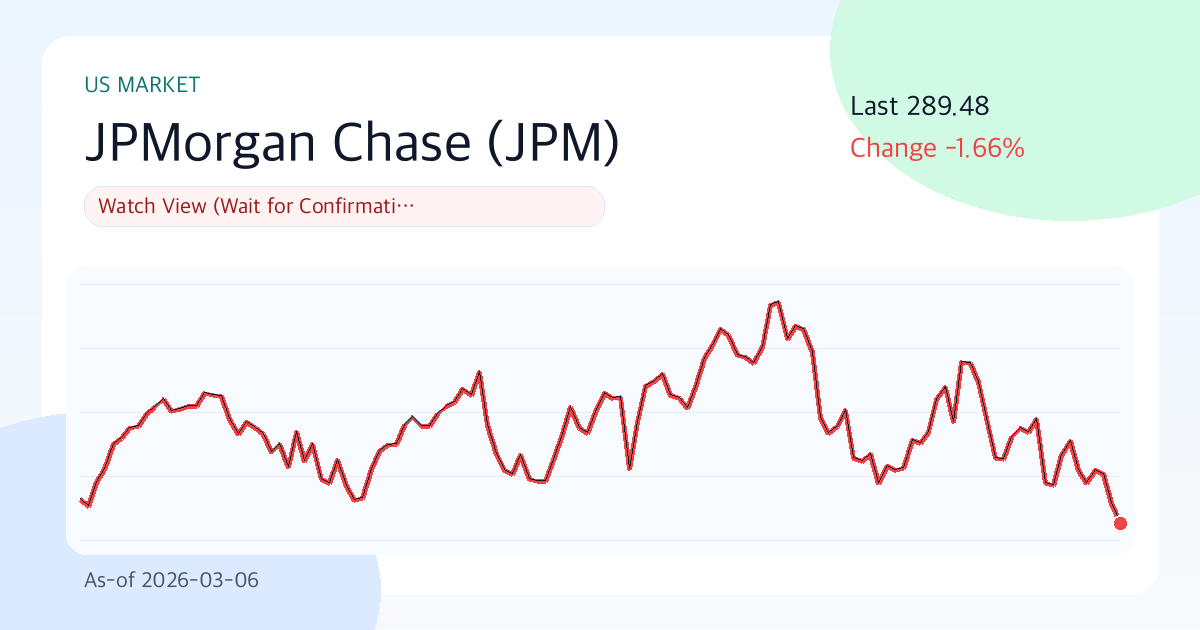
JPMorgan Chase(JPM) 289.48 | 3M -8.4% | Vol 26.8% | Risk Management Priority Zone (As of: 2026-03-06)
Summary
- One-line assessment: Wait-and-see approach (Respond after confirmation)
- Confidence level: High
- Comment: JPMorgan Chase is currently trading at $289.48, leaving room for a potential trend reversal despite short-term headwinds. The key is to confirm the balance between financial soundness and the valuation assigned by the market. Rather than making hasty bets, it is wise to clearly define the conditions under which you would change your position.
Key Points (3 Lines)
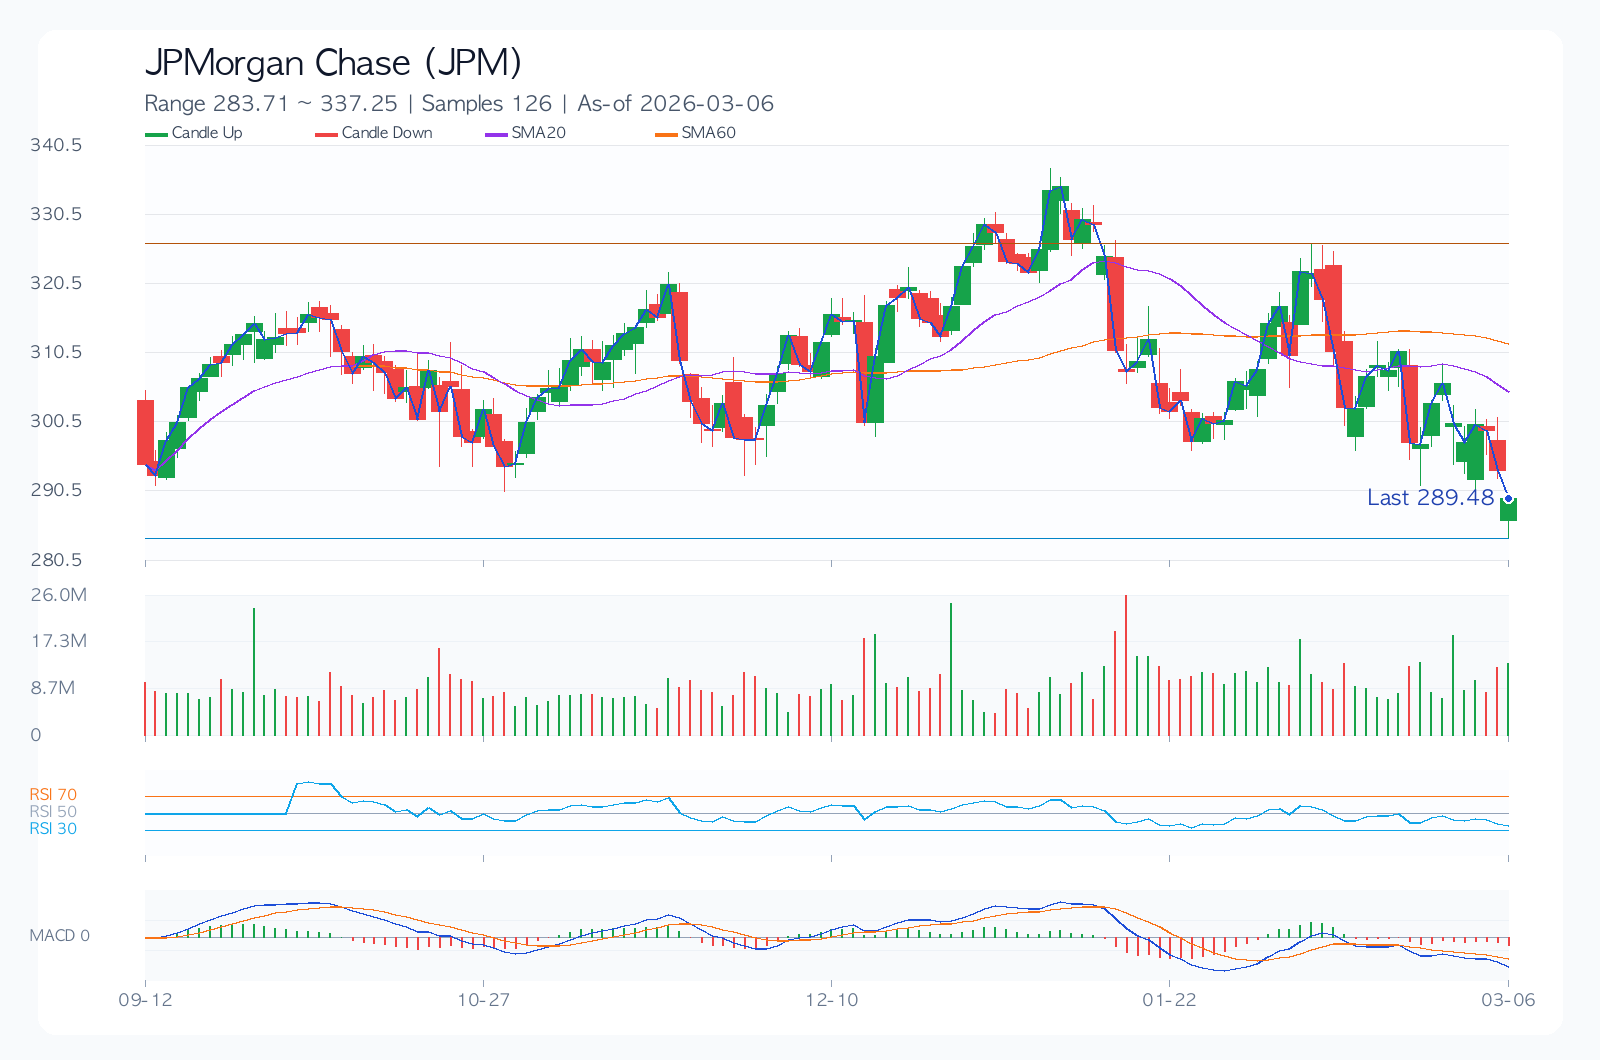
- The key observation for this period is whether the price remains above the 20-day moving average ($304.92). If it does, short-term supply and demand are likely to be favorable.
- The combination of a 41.1% margin and 16.1% ROE signals that the core business is not weak, but a D/E ratio of 3.00 requires checking interest rate sensitivity.
- Based on a dividend yield of 2.1% and an average payout ratio of 29.0%, dividend sustainability is rated as 'Caution'.
Looking at JPMorgan Chase's chart today, the first thing you notice is the rhythm rather than the numbers. While headwinds are currently dominant, the possibility of a trend reversal remains open. Therefore, it is more advantageous to decide in advance 'under what conditions you will change your judgment' rather than reaching hasty conclusions.
Investment Logic (Value)
In periods of weak momentum, the quality of numbers must be scrutinized more rigorously than the story. If the quality of earnings generated by JPMorgan Chase is maintained and the price the market assigns to those earnings (PER 14.4, PBR 2.3) does not collapse excessively, the current valuation will become more explanatory over time.
The core logic is 'Can the combination of financial strength (41.1% margin, 16.1% ROE) and current price momentum (3-month -8.4%) create a re-rating in the next 1-2 quarters?'
- Growth: Revenue growth of 2.5% suggests a potential slowdown in growth.
- Profitability: An operating margin of 41.1% and ROE of 16.1% can be interpreted as having the potential to be top-tier in the industry.
- Valuation: PER of 14.4 and PBR of 2.3 are classified as neutral to reasonable.
- Capital Return: The combination of an average payout ratio of 29.0% and a dividend yield of 2.1% is positive for shareholder return attractiveness.
Unique Argument of This Report (Basis)
- The primary basis for the current assessment is the supply and demand dynamics created by the recent 3-month return of -8.4% and the price's position relative to the 20-day moving average ($304.92).
- Financial strength is assessed by operating margin (41.1%) and ROE (16.1%); if both decline simultaneously, the investment logic's quality will rapidly weaken.
- The valuation metrics are PER 14.4 and PBR 2.3. The core of this report is whether 'this valuation is excessive relative to the 2.5% growth rate.'
Technical Analysis
Technically, this is a juncture where conviction and doubt coexist. Therefore, level management (Support $289.48 / Resistance $322.40) is likely to account for most of the performance, rather than chasing the price.
- Trend: The 20-day/60-day/120-day moving averages are $304.92/$311.96/$309.89, indicating a mixed or inverse arrangement.
- Momentum: 1-month -6.7%, 3-month -8.4%, 6-month -1.7%, showing directional uncertainty.
- Overbought/Oversold: RSI(14) is 37.9, in the neutral zone.
- Volatility/Drawdown: 30-day annualized volatility of 26.8% and maximum drawdown of -24.9% should be used as benchmarks for position sizing.
- Price Levels: A trend reversal is likely when the short-term support level of $289.48 or resistance level of $322.40 is broken or breached.
Desk Memo (Light Comment)
While not a dramatic market, adhering to rules in these everyday market conditions actually creates performance.
Key Chart
Financial Statements and Indicators
| Category | Value |
|---|---|
| Overall Score | 53.5/100 |
| Value/Technical/Risk | 51.8 / 36.7 / 87.0 |
| Current Price | 289.48 |
| 1M/3M/6M Returns | -6.7% / -8.4% / -1.7% |
| 30-Day Annualized Volatility | 26.8% |
| Max Drawdown (MDD) | -24.9% |
| 52-Week Range | 210.28 ~ 334.61 |
| 20/60/120-Day MA | 304.92 / 311.96 / 309.89 |
| RSI(14) | 37.9 |
| Short-Term Support/Resistance | 289.48 / 322.40 |
| Revenue Growth Rate | 2.5% |
| Operating Margin | 41.1% |
| ROE | 16.1% |
| D/E | 3.00 |
| PER / PBR | 14.4 / 2.3 |
| Dividend Yield | 2.1% |
Dividends (History & Sustainability)
More important than the yield itself is whether the policy is maintained even when the economy and earnings fluctuate. The current assessment is 'Caution'.
| Year | DPS | Payout Ratio |
|---|---|---|
| 2022 | 4.00 | 29.0% |
| 2023 | 4.05 | 29.0% |
| 2024 | 4.60 | 29.0% |
| 2025 | 5.55 | 29.0% |
Investment Guru Perspective Simulation
The following content is not a reproduction of actual guru trades, but a style simulation applying the core questions of each investment philosophy to current data.
| Perspective | Style Score (0-100) | Current Observation | Hypothetical Action Scenario |
|---|---|---|---|
| Warren Buffett Perspective (Quality & Margin of Safety) | 31.0 | ROE 16.1%, Operating Margin 41.1%, D/E 3.00, PER 14.4 | Quality confirmed, but insufficient margin of safety in price; holding off. |
| Peter Lynch Perspective (Growth & Price Balance) | 0.0 | Revenue Growth Rate 2.5%, PEG Ratio approx. 5.78, 6-Month Return -1.7% | Story exists, but growth appeal relative to price is weak. |
| George Soros Perspective (Trend & Speed of Reaction) | 33.7 | 1M/3M Returns -6.7%/-8.4%, Volatility 26.8%, RSI 37.9 | Trend reliability is low; waiting for confirmation signals, only acting on signs of reversal. |
Key Risks
Responding to bad scenarios is more important than good ones. For JPMorgan Chase, the current risk statement is closer to a safety net for maintaining a position rather than a warning. In the current phase, changes in valuation metrics (PER 14.4, PBR 2.3) and 30-day annualized volatility (26.8%) can significantly influence the speed of downside risk.
- High financial leverage (D/E 3.00) makes it vulnerable to rising interest rates or increased refinancing costs.
- Changes in consensus estimates and guidance comments before and after earnings announcements can influence short-term direction.
- Valuation frameworks can change rapidly due to regulatory, litigation, or policy shifts (trade, antitrust, financial regulations, etc.).
- Changes in the competitive intensity of core businesses could weaken the ability to defend market share and profit margins.
Contrarian Arguments and Invalidation Conditions
The contrarian argument is that 'if valuation burden (PER 14.4, PBR 2.3) or demand slowdown is confirmed, multiple contraction may outpace earnings improvement.'
- If the price remains below the short-term support level of $289.48 for more than two weeks, the current trend assumption is invalidated.
- If the next quarter's revenue growth rate slows to below 0.0%, the growth assumption needs re-evaluation.
- If consensus EPS is revised downwards for four consecutive weeks after the earnings announcement, the base scenario will be lowered.
Checklist
Must-See Before Next Announcement/Earnings
- Confirm if revenue growth rate is maintained above 0.5% in the next quarterly earnings.
- Confirm if the stock price defends the short-term support level of $289.48.
- Confirm if consensus EPS estimates are revised upwards for four consecutive weeks.
Portfolio Operation Memo
Volatility is not in an overheated zone, but the magnitude of fluctuations around events remains significant. Since it's in the neutral zone, an approach that sets conditional entry criteria before betting on direction is reasonable.
Pre-Decision Check
- Have the direction of consensus EPS for the next two quarters (upward/downward) been confirmed?
- Can the financial structure (D/E, interest coverage, cash flow) withstand an economic slowdown?
- Does the entry price secure a risk-reward ratio of at least 1:2 relative to support/resistance levels?
- Are dividend policy (increase/maintain/decrease) and share buyback policy consistently followed?
- Has the maximum acceptable loss been defined in advance in case of a pessimistic scenario?
Conclusion (Optimistic, Base, Pessimistic 3 Scenarios)
| Scenario | Assumption | Key Trigger | Target Price (Model) | Expected Return |
|---|---|---|---|---|
| Optimistic | Simultaneous earnings surprise and multiple defense | Accelerating revenue growth + upward guidance revision | 311.04 | 7.4% |
| Base | Earnings meet consensus, multiples remain neutral | Margin defense + neutral supply/demand | 277.71 | -4.1% |
| Pessimistic | Simultaneous earnings slowdown and multiple contraction | Downward guidance revision + widening risk premium | 227.72 | -21.3% |
The target price for the base scenario is $277.71. However, given the wide gap between the optimistic (7.4%) and pessimistic (-21.3%) scenarios, it is reasonable to view this stock as being in a phase where 'conditional response' is more important than finding the 'correct answer.'
Data Sources
- Data As of:
2026-03-06 - Report Generated On:
2026-03-07 - Original Stock Link: https://finance.yahoo.com/quote/JPM
- Source Data: Yahoo Finance Price/Quote
Related Reports
Recent notes from the same market to compare assumptions.
- Broadcom(AVGO) 330.48 | 3M -13.3% | Vol 37.5% | Entry Timing Check Zone (As of: 2026-03-06) (As-of 2026-03-06)
- Meta Platforms(META) 644.86 | 3M -2.5% | Vol 40.0% | Entry Timing Check Zone (As of: 2026-03-06) (As-of 2026-03-06)
- Exxon Mobil(XOM) 151.21 | 3M +29.1% | Vol 28.3% | Entry Timing Check Zone (As of: 2026-03-06) (As-of 2026-03-06)
- Coupang(CPNG) 19.08 | 3M -31.6% | Vol 53.8% | Risk Management Priority Zone (As of: 2026-02-27) (As-of 2026-02-27)