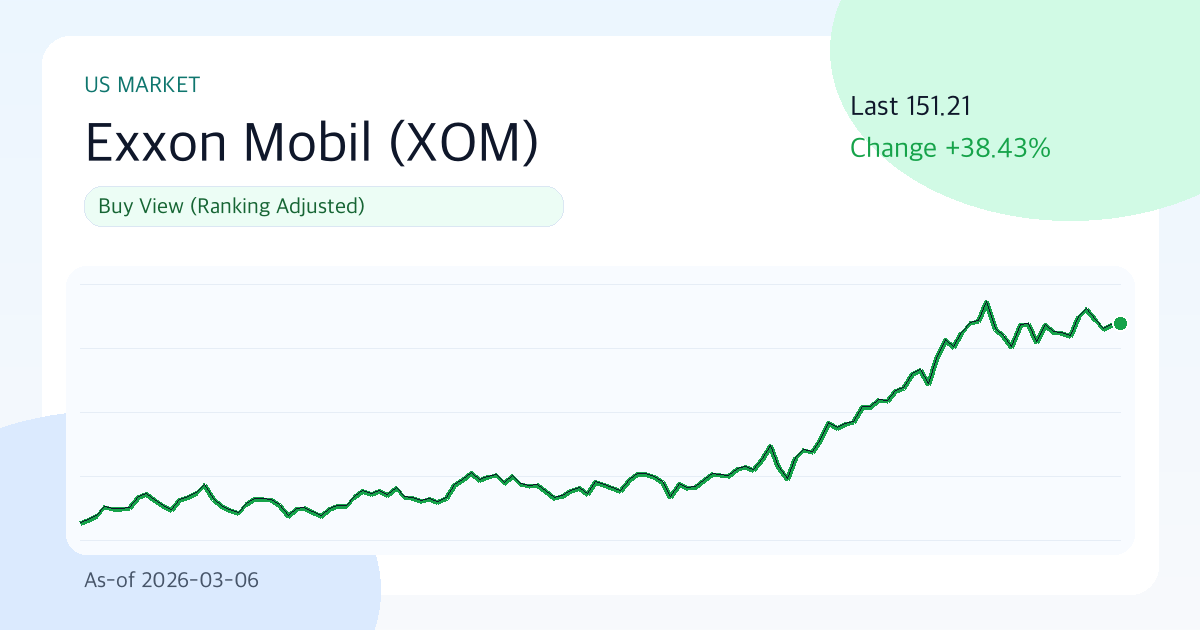
Exxon Mobil(XOM) 151.21 | 3M +29.1% | Vol 28.3% | Entry Timing Check Zone (As of: 2026-03-06)
Summary
- One-line judgment: Buy (Ranking Adjusted)
- Confidence: High
- Comment: Overall score is 66.9/100 (Value 51.7, Technical 71.1, Risk 94.0). Current price is 151.21, short-term support/resistance is 134.84/155.56, and the 30-day annualized volatility is 28.3%. Adjusted to a buy perspective for portfolio balance (minimum buy weight).
Key Points (3 Lines)
- The key point for this period is whether the price stays above the 20-day moving average (150.44). If it does, short-term supply and demand are likely to be favorable.
- The combination of a 9.5% margin and 11.1% ROE signals that the core business is not weak, but the D/E ratio of 0.20 requires checking interest rate sensitivity.
- Based on a dividend yield of 2.7% and an average payout ratio of 59.7%, dividend sustainability is rated 'Average'.
Looking at Exxon Mobil's chart today, rhythm is more apparent than numbers. The current period is neutral, and confidence largely depends on data updates. Therefore, it's more advantageous to pre-determine 'under what conditions the judgment will change' rather than rushing to conclusions.
Investment Logic (Value)
The core judgment leans towards the balance between the quality of earnings and price, rather than complex narratives. If Exxon Mobil's earnings quality is maintained and the market price (PER 22.6, PBR 2.4) for those earnings doesn't collapse excessively, the current valuation will become more explanatory over time.
The core logic is whether the combination of 'financial strength (9.5% margin, 11.1% ROE) and current price momentum (29.1% over 3 months)' can create a re-rating in the next 1-2 quarters.
- Growth: Revenue growth rate of -1.3% suggests potential for slowing growth.
- Profitability: Operating margin of 9.5% and ROE of 11.1% are interpreted as within the normal range or at the lower end.
- Valuation: PER of 22.6 and PBR of 2.4 are classified as neutral to reasonable.
- Capital Return: The combination of an average payout ratio of 59.7% and a dividend yield of 2.7% is positive for shareholder return attractiveness.
Unique Argument of This Report (Basis)
- The primary basis for the current judgment is the supply and demand dynamics created by the recent 3-month return of 29.1% and its position relative to the 20-day moving average (150.44).
- Financial strength is assessed by operating margin (9.5%) and ROE (11.1%); if both decline simultaneously, the investment logic's quality will rapidly weaken.
- The valuation metrics are PER 22.6 and PBR 2.4. The core of this report is whether 'this valuation is excessive compared to the -1.3% growth rate'.
Technical Analysis
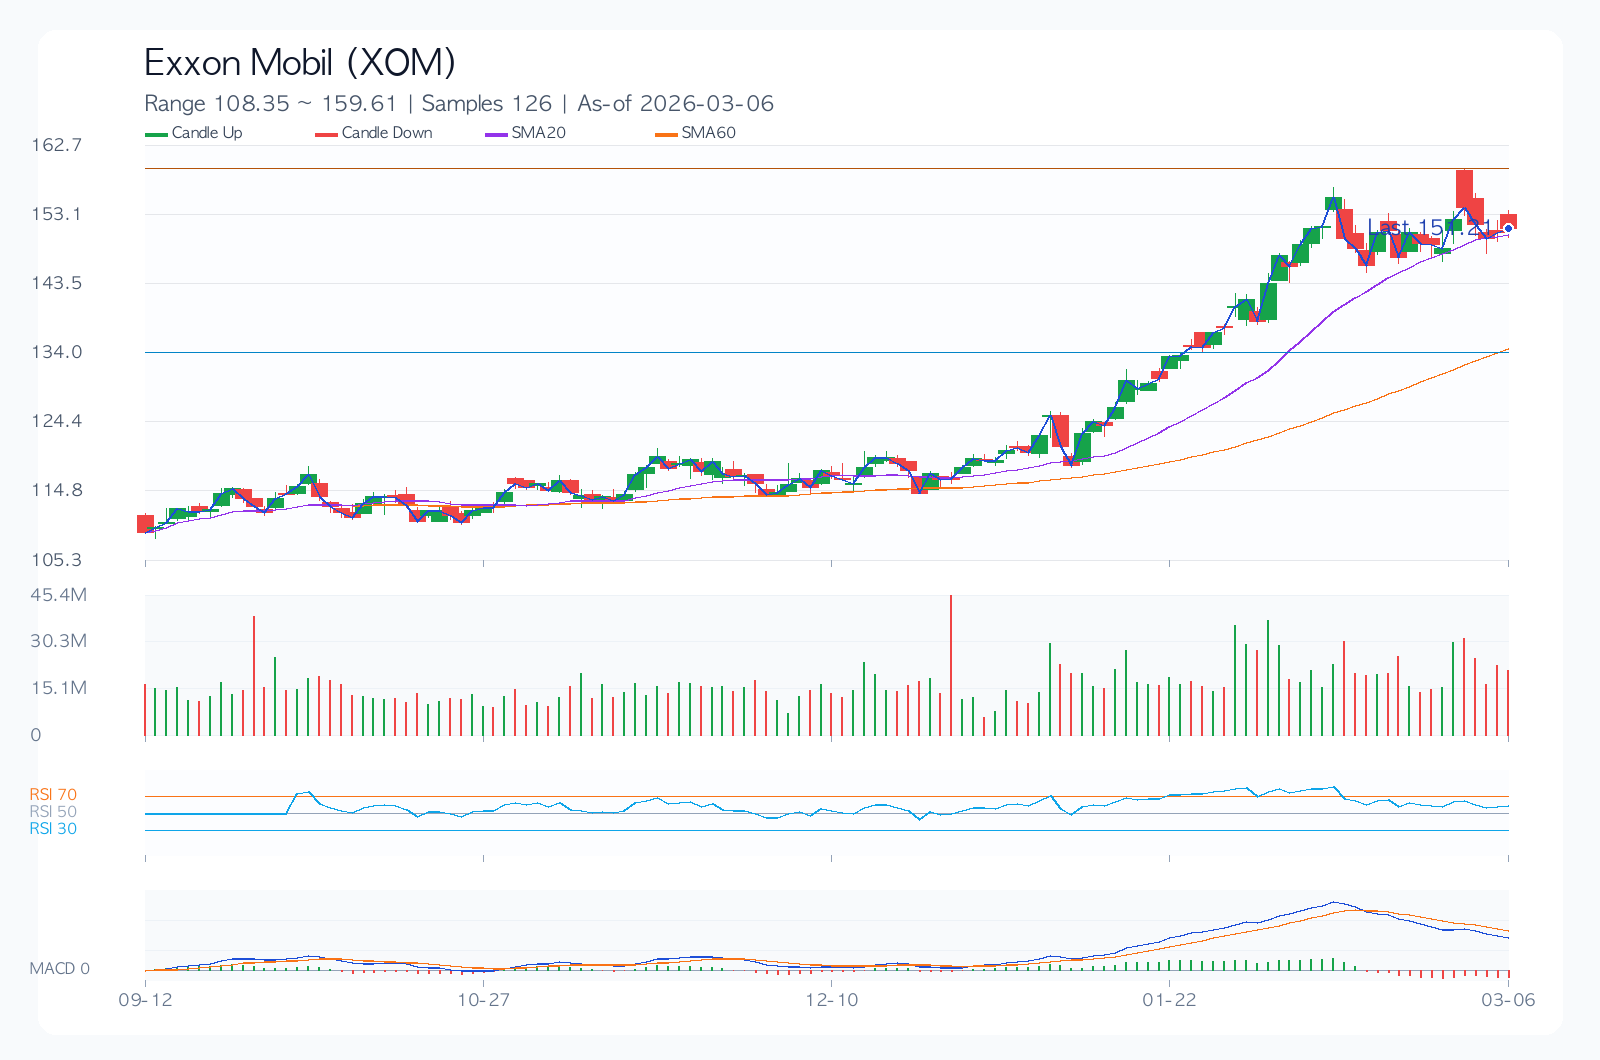
Technically, this is a juncture where conviction and doubt coexist. Therefore, level management (Support 134.84 / Resistance 155.56) is likely to account for most of the performance, rather than chasing the price.
- Trend: 20-day/60-day/120-day moving averages are 150.44/134.67/124.80, respectively, in a positive alignment.
- Momentum: 1-month 3.5%, 3-month 29.1%, 6-month 38.4%, indicating mid-term momentum advantage.
- Overbought/Oversold: RSI(14) is 55.0, in the neutral zone.
- Volatility/Drawdown: 30-day annualized volatility of 28.3% and maximum drawdown of -20.3% should be used as benchmarks for position sizing.
- Price Levels: Trend reversal is likely when the short-term support at 134.84 or resistance at 155.56 is broken.
Desk Memo (Brief Comment)
While not a dramatic market, adhering to rules in these everyday market conditions can actually lead to performance.
Key Chart
Financial Statements/Indicators
| Category | Value |
|---|---|
| Overall Score | 66.9/100 |
| Value/Technical/Risk | 51.7 / 71.1 / 94.0 |
| Current Price | 151.21 |
| 1M/3M/6M Return | 3.5% / 29.1% / 38.4% |
| 30-Day Annualized Volatility | 28.3% |
| Max Drawdown (MDD) | -20.3% |
| 52-Week Range | 99.93 ~ 155.56 |
| 20/60/120-Day MA | 150.44 / 134.67 / 124.80 |
| RSI(14) | 55.0 |
| Short-term Support/Resistance | 134.84 / 155.56 |
| Revenue Growth Rate | -1.3% |
| Operating Margin | 9.5% |
| ROE | 11.1% |
| D/E | 0.20 |
| PER / PBR | 22.6 / 2.4 |
| Dividend Yield | 2.7% |
Dividends (History/Sustainability)
Dividends are more important for their policy stability during economic and earnings fluctuations than for the yield itself. The current assessment is 'Average'.
| Year | DPS | Payout Ratio |
|---|---|---|
| 2022 | 3.55 | 59.7% |
| 2023 | 3.68 | 59.7% |
| 2024 | 3.84 | 59.7% |
| 2025 | 4.00 | 59.7% |
Investment Guru Perspective Simulation
The following content is not a reproduction of actual guru trades but a style simulation applying the core questions of each investment philosophy to current data.
| Perspective | Style Score (0-100) | Current Focus | Hypothetical Action Scenario |
|---|---|---|---|
| Warren Buffett (Quality/Margin of Safety) | 39.1 | ROE 11.1%, Operating Margin 9.5%, D/E 0.20, PER 22.6 | Quality confirmed, but insufficient price margin of safety; hold. |
| Peter Lynch (Growth/Price Balance) | 0.0 | Revenue Growth -1.3%, PEG-like ratio 22.57, 6-month Return 38.4% | Story exists, but growth appeal relative to price is weak. |
| George Soros (Trend/Responsiveness) | 76.2 | 1M/3M Return 3.5%/29.1%, Volatility 28.3%, RSI 55.0 | Price is responsive in this period; strengthen short-term trading perspective if catalysts emerge. |
Key Risks
Responding to bad scenarios is more important than good ones. For Exxon Mobil, the current risk statement serves as a safety net for maintaining a position rather than a warning. In the current phase, changes in valuation metrics (PER 22.6, PBR 2.4) and 30-day annualized volatility (28.3%) can significantly influence the speed of downside risk.
- Low operating margins make it difficult to defend profits against cost increases or pricing competition.
- Changes in consensus estimates and guidance comments before/after earnings announcements can dictate short-term direction.
- Valuation frameworks can change rapidly due to regulatory, litigation, or policy shifts (trade, antitrust, financial regulations, etc.).
- Weakening competitive intensity in core businesses could erode market share and profit margins.
Counterarguments and Invalidation Conditions
The counterargument is that 'valuation burden (PER 22.6, PBR 2.4) or demand slowdown could lead to multiple compression faster than earnings improvement.'
- If the price remains below the short-term support level of 134.84 for more than two weeks, the current trend assumption will be invalidated.
- If the next quarter's revenue growth slows to below 0.0%, the growth assumption needs re-evaluation.
- If consensus EPS is revised downwards for four consecutive weeks after earnings announcements, the base scenario will be lowered.
Checklist
Must-See Before Next Disclosure/Earnings
- Confirm if revenue growth rate is maintained at 0.0% or higher in the next quarterly earnings.
- Confirm if the stock price defends the short-term support level of 134.84.
- Confirm if consensus EPS estimates are revised upwards for four consecutive weeks.
Portfolio Management Notes
Volatility is not in an overheated zone, but price swings around events remain significant. Since it's in a neutral range, an approach that prioritizes setting conditional entry criteria over directional bets is reasonable.
Pre-Decision Check
- Have the direction of consensus EPS for the next two quarters (upward/downward) been confirmed?
- Can the financial structure (D/E, interest coverage, cash flow) withstand an economic slowdown?
- Does the entry price secure a risk-reward ratio of at least 1:2 relative to support/resistance levels?
- Are dividend policy (increase/maintain/decrease) and share buyback policies consistently followed?
- Has the maximum acceptable loss limit in case of a pessimistic scenario been pre-defined?
Conclusion (Optimistic, Base, Pessimistic 3 Scenarios)
| Scenario | Assumption | Key Trigger | Target Price (Model) | Expected Return |
|---|---|---|---|---|
| Optimistic | Simultaneous earnings surprise and multiple defense | Accelerating revenue growth + upward guidance | 173.55 | 14.8% |
| Base | Earnings meet consensus, multiple remains neutral | Margin defense + neutral supply/demand | 154.95 | 2.5% |
| Pessimistic | Simultaneous earnings slowdown and multiple contraction | Downward guidance + increased risk premium | 127.06 | -16.0% |
The target price for the base scenario is 154.95. However, given the wide gap between the optimistic (14.8%) and pessimistic (-16.0%) scenarios, it is reasonable to view this stock as being in a phase where 'conditional response' is more important than finding the 'correct answer'.
Data Sources
- Data As of:
2026-03-06 - Report Generated On:
2026-03-07 - Original Stock Link: https://finance.yahoo.com/quote/XOM
- Source Data: Yahoo Finance Price/Quote
Related Reports
Recent notes from the same market to compare assumptions.
- JPMorgan Chase(JPM) 289.48 | 3M -8.4% | Vol 26.8% | Risk Management Priority Zone (As of: 2026-03-06) (As-of 2026-03-06)
- Broadcom(AVGO) 330.48 | 3M -13.3% | Vol 37.5% | Entry Timing Check Zone (As of: 2026-03-06) (As-of 2026-03-06)
- Meta Platforms(META) 644.86 | 3M -2.5% | Vol 40.0% | Entry Timing Check Zone (As of: 2026-03-06) (As-of 2026-03-06)
- Coupang(CPNG) 19.08 | 3M -31.6% | Vol 53.8% | Risk Management Priority Zone (As of: 2026-02-27) (As-of 2026-02-27)